Draw.io File Format Guide
The .drawio format is an open XML standard for diagrams that works across desktop apps, VS Code, Confluence, and Git. This guide explains its structure, portability advantages, and version control workflow.
What the .drawio format is: mxGraphModel XML under the hood
The Draw.io file format is an XML document rooted in a <mxGraphModel> element. Every .drawio file you create, whether in Draw.io desktop, the browser editor, or a third-party tool, produces this same XML structure. The format was originally defined by the mxGraph JavaScript library, which JGraph Ltd developed and open-sourced. When JGraph rebranded their product from mxGraph to Draw.io and later to Diagrams.net, the underlying XML format remained unchanged. This stability is the format's greatest strength. A .drawio file created in 2015 opens without modification in the 2024 editor. The XML starts with an <mxGraphModel> root element containing attributes for page dimensions, grid size, and math rendering options. Inside it, a <root> element holds <mxCell> elements that represent every object in the diagram: shapes, connections, labels, groups, and the default parent cells (id='0' for the root and id='1' for the default layer). Each mxCell has an id, a style string, a value (the label text), and optional child elements like <mxGeometry> that define position, size, and control points. The format supports multiple pages through <diagram> wrapper elements, each containing its own <mxGraphModel>. Compressed .drawio files base64-encode and deflate the XML content within the diagram element. Uncompressed files store the XML as plain text, which is what you want for version control. Draw.io's Edit > Preferences > Compressed option controls this behavior.
File structure: mxCell elements, styles, and geometry
Every visual element in a .drawio diagram is an mxCell. A rectangle shape might look like: <mxCell id='2' value='API Gateway' style='rounded=1;whiteSpace=wrap;fillColor=#dae8fc;strokeColor=#6c8ebf;' vertex='1' parent='1'><mxGeometry x='200' y='100' width='120' height='60' as='geometry'/></mxCell>. The id uniquely identifies the cell. The value is the displayed text. The vertex='1' attribute marks it as a shape (as opposed to an edge). The parent='1' refers to the default layer. The style attribute is a semicolon-delimited list of key-value pairs that control appearance. Common style properties include: shape (the base shape type like 'mxgraph.aws4.lambda' for an AWS Lambda icon), fillColor and strokeColor for colors, fontSize and fontFamily for text, rounded for corner radius, and whiteSpace=wrap to enable text wrapping. Cloud provider icons use shape styles that reference specific stencil libraries. An AWS EC2 instance uses shape=mxgraph.aws4.ec2. An Azure VM uses shape=mxgraph.azure.virtual_machine. These stencil references map to SVG definitions in Draw.io's shape libraries. Connections between shapes are mxCell elements with edge='1' instead of vertex='1'. An edge cell has source and target attributes referencing the id values of the shapes it connects. The style on an edge controls arrow type (endArrow, startArrow), line style (dashed, curved, orthogonal), and stroke properties. mxGeometry on edges defines control points that route the connection path. The Array element within mxGeometry holds mxPoint entries for each waypoint along the edge. Groups are mxCell elements with container='1' in their style and child cells with their parent attribute set to the group's id. This nesting lets you create VPC boundaries containing subnets containing services, with each level maintaining proper parent-child relationships in the XML.
Why .drawio matters: portability versus proprietary format lock-in
Diagram formats create lock-in more quietly than most technology choices. Lucidchart stores diagrams in a proprietary format accessible only through their web application and API. Miro boards exist only within Miro. Figma files require Figma to open. If you cancel your subscription to any of these tools, your diagrams become inaccessible or require manual recreation in another format. The .drawio format is different. It's an open XML format that you can read, write, and manipulate with any text editor or XML parser. The file lives on your filesystem, in your Git repository, or on your cloud storage. No vendor controls access. If Draw.io disappeared tomorrow, your diagrams would still be readable by any tool that parses mxGraphModel XML, and you could write a parser in any language in an afternoon. Export-based portability is not the same as format portability. Lucidchart can export to PNG, SVG, or PDF, but those are rasterized or flattened outputs. You lose the ability to edit individual shapes, connections, and styles. Exporting a Lucidchart diagram to Visio format produces a .vsdx file, but the conversion is lossy: custom shapes become generic rectangles, and styling changes. The .drawio format preserves every attribute of every element because it is the native format, not an export target. For organizations that standardize on Draw.io for architecture diagrams, the format choice has a compounding effect. Hundreds of diagrams accumulate over years. When they're stored in an open format in Git repositories alongside the code they document, they remain accessible regardless of which tools the organization uses in the future. When they're stored in a proprietary SaaS tool, they become a liability during contract negotiations.
Where .drawio files work: desktop, VS Code, Confluence, Google Drive, Git
Draw.io Desktop (also called Diagrams.net Desktop) is an Electron-based application for macOS, Windows, and Linux. It reads and writes .drawio files natively with no account required, no internet connection needed, and no data sent to external servers. This makes it the preferred editor for organizations with strict data residency requirements. Diagrams stay on local machines or internal file shares. The Draw.io VS Code extension by Hediet turns VS Code into a diagram editor. Open any .drawio file in VS Code and it renders in a visual editor tab. Edit shapes, connections, and styles visually, then save. The file stays in your workspace alongside your code. This integration is why many development teams adopt .drawio: the diagram editor lives inside the tool they already use for 8 hours a day. The Atlassian Confluence integration embeds .drawio diagrams directly in wiki pages. The Draw.io plugin for Confluence Server, Data Center, and Cloud stores diagram data within Confluence but renders it using the same mxGraph engine. Teams can edit diagrams in context without switching applications. The diagrams update in real-time within the wiki page. Google Drive integration lets you create and edit .drawio files stored in Google Drive. The Draw.io Google Workspace add-on opens a full diagram editor within the Google Drive interface. Shared drives work, making it suitable for teams that use Google Workspace for collaboration. Git repositories are the most powerful storage for .drawio files because they enable version tracking, diff review, and branch-based editing. Store diagrams in a /docs/architecture/ directory next to the code they describe. When a pull request changes the architecture, include the updated .drawio file in the same commit. Reviewers can see both the code change and the diagram change in a single review.
Version control with .drawio: meaningful diffs and merge strategies
The .drawio XML format is text-based, which means Git tracks every change as a line-level diff. When you move a shape from position (200, 100) to (300, 150), the diff shows the mxGeometry element changing from x='200' y='100' to x='300' y='150'. When you change a label from 'Auth Service' to 'Identity Service,' the diff shows the value attribute changing. These diffs are meaningful and reviewable, unlike binary image formats where any change produces a complete file replacement. To get clean diffs, store .drawio files in uncompressed format. Compressed .drawio files base64-encode the XML content, which produces unreadable diffs. In Draw.io Desktop, go to Edit > Preferences and uncheck 'Compressed.' The resulting XML is larger but diffable. For repositories with many diagrams, the size increase is negligible compared to the review quality improvement. Merge conflicts happen when two branches modify the same diagram. Because .drawio is XML, Git's text-based merge can handle many cases automatically: one branch adds a shape and another modifies a different shape. Conflicts occur when both branches modify the same mxCell element. Resolve these by opening the conflicted file in Draw.io (after manually resolving the XML conflict markers), verifying the visual result, and committing. For teams that modify diagrams frequently, consider a convention where each major diagram component lives on a separate Draw.io page. This reduces the likelihood of merge conflicts since pages are separate <diagram> elements in the XML. GitHub, GitLab, and Bitbucket don't render .drawio files natively in pull request previews. Some teams work around this by exporting a PNG alongside the .drawio file and including both in the commit. The PNG provides a visual preview in the PR, and the .drawio file remains the editable source of truth. Automated CI/CD pipelines can generate the PNG from the .drawio file using draw.io's command-line export tool.
Generating .drawio files with AI instead of manual drawing
Creating .drawio files manually means opening Draw.io, dragging shapes from the sidebar, positioning them on the canvas, drawing connections, adjusting styles, and aligning everything to a grid. For a 10-component architecture diagram, this takes 15 to 30 minutes. The cognitive overhead is in the layout decisions: how far apart should components be? Where do connection lines route to avoid crossings? How do you group related components visually? AI diagram generation produces valid .drawio XML from natural language descriptions. You describe the system: 'A Next.js frontend behind CloudFront, an API Gateway routing to three Lambda functions, DynamoDB for user data, S3 for file storage, and SQS for background job processing.' The AI generates a complete mxGraphModel with correctly styled mxCell elements, proper geometry positioning, labeled connections, and cloud provider icons. The output file is identical in structure to one created manually in Draw.io. It opens, edits, and saves in every tool that supports the .drawio format. The shapes have proper style attributes. The connections have correct source and target references. The geometry is grid-aligned. This matters because the generated file isn't a screenshot or a locked export. It's a fully editable .drawio file. Move shapes, change labels, add components, modify styles. The AI handles the initial layout. You handle the refinements. Diagrams.so generates .drawio files from text descriptions with support for AWS, Azure, and GCP icon sets. Describe your architecture, select the cloud provider, and get a .drawio file that opens in Draw.io desktop, VS Code, Confluence, or any mxGraph-compatible editor. The output follows .drawio conventions with proper mxCell structure, labeled connections, and grid alignment, ready for version control alongside your code.
Real-world examples
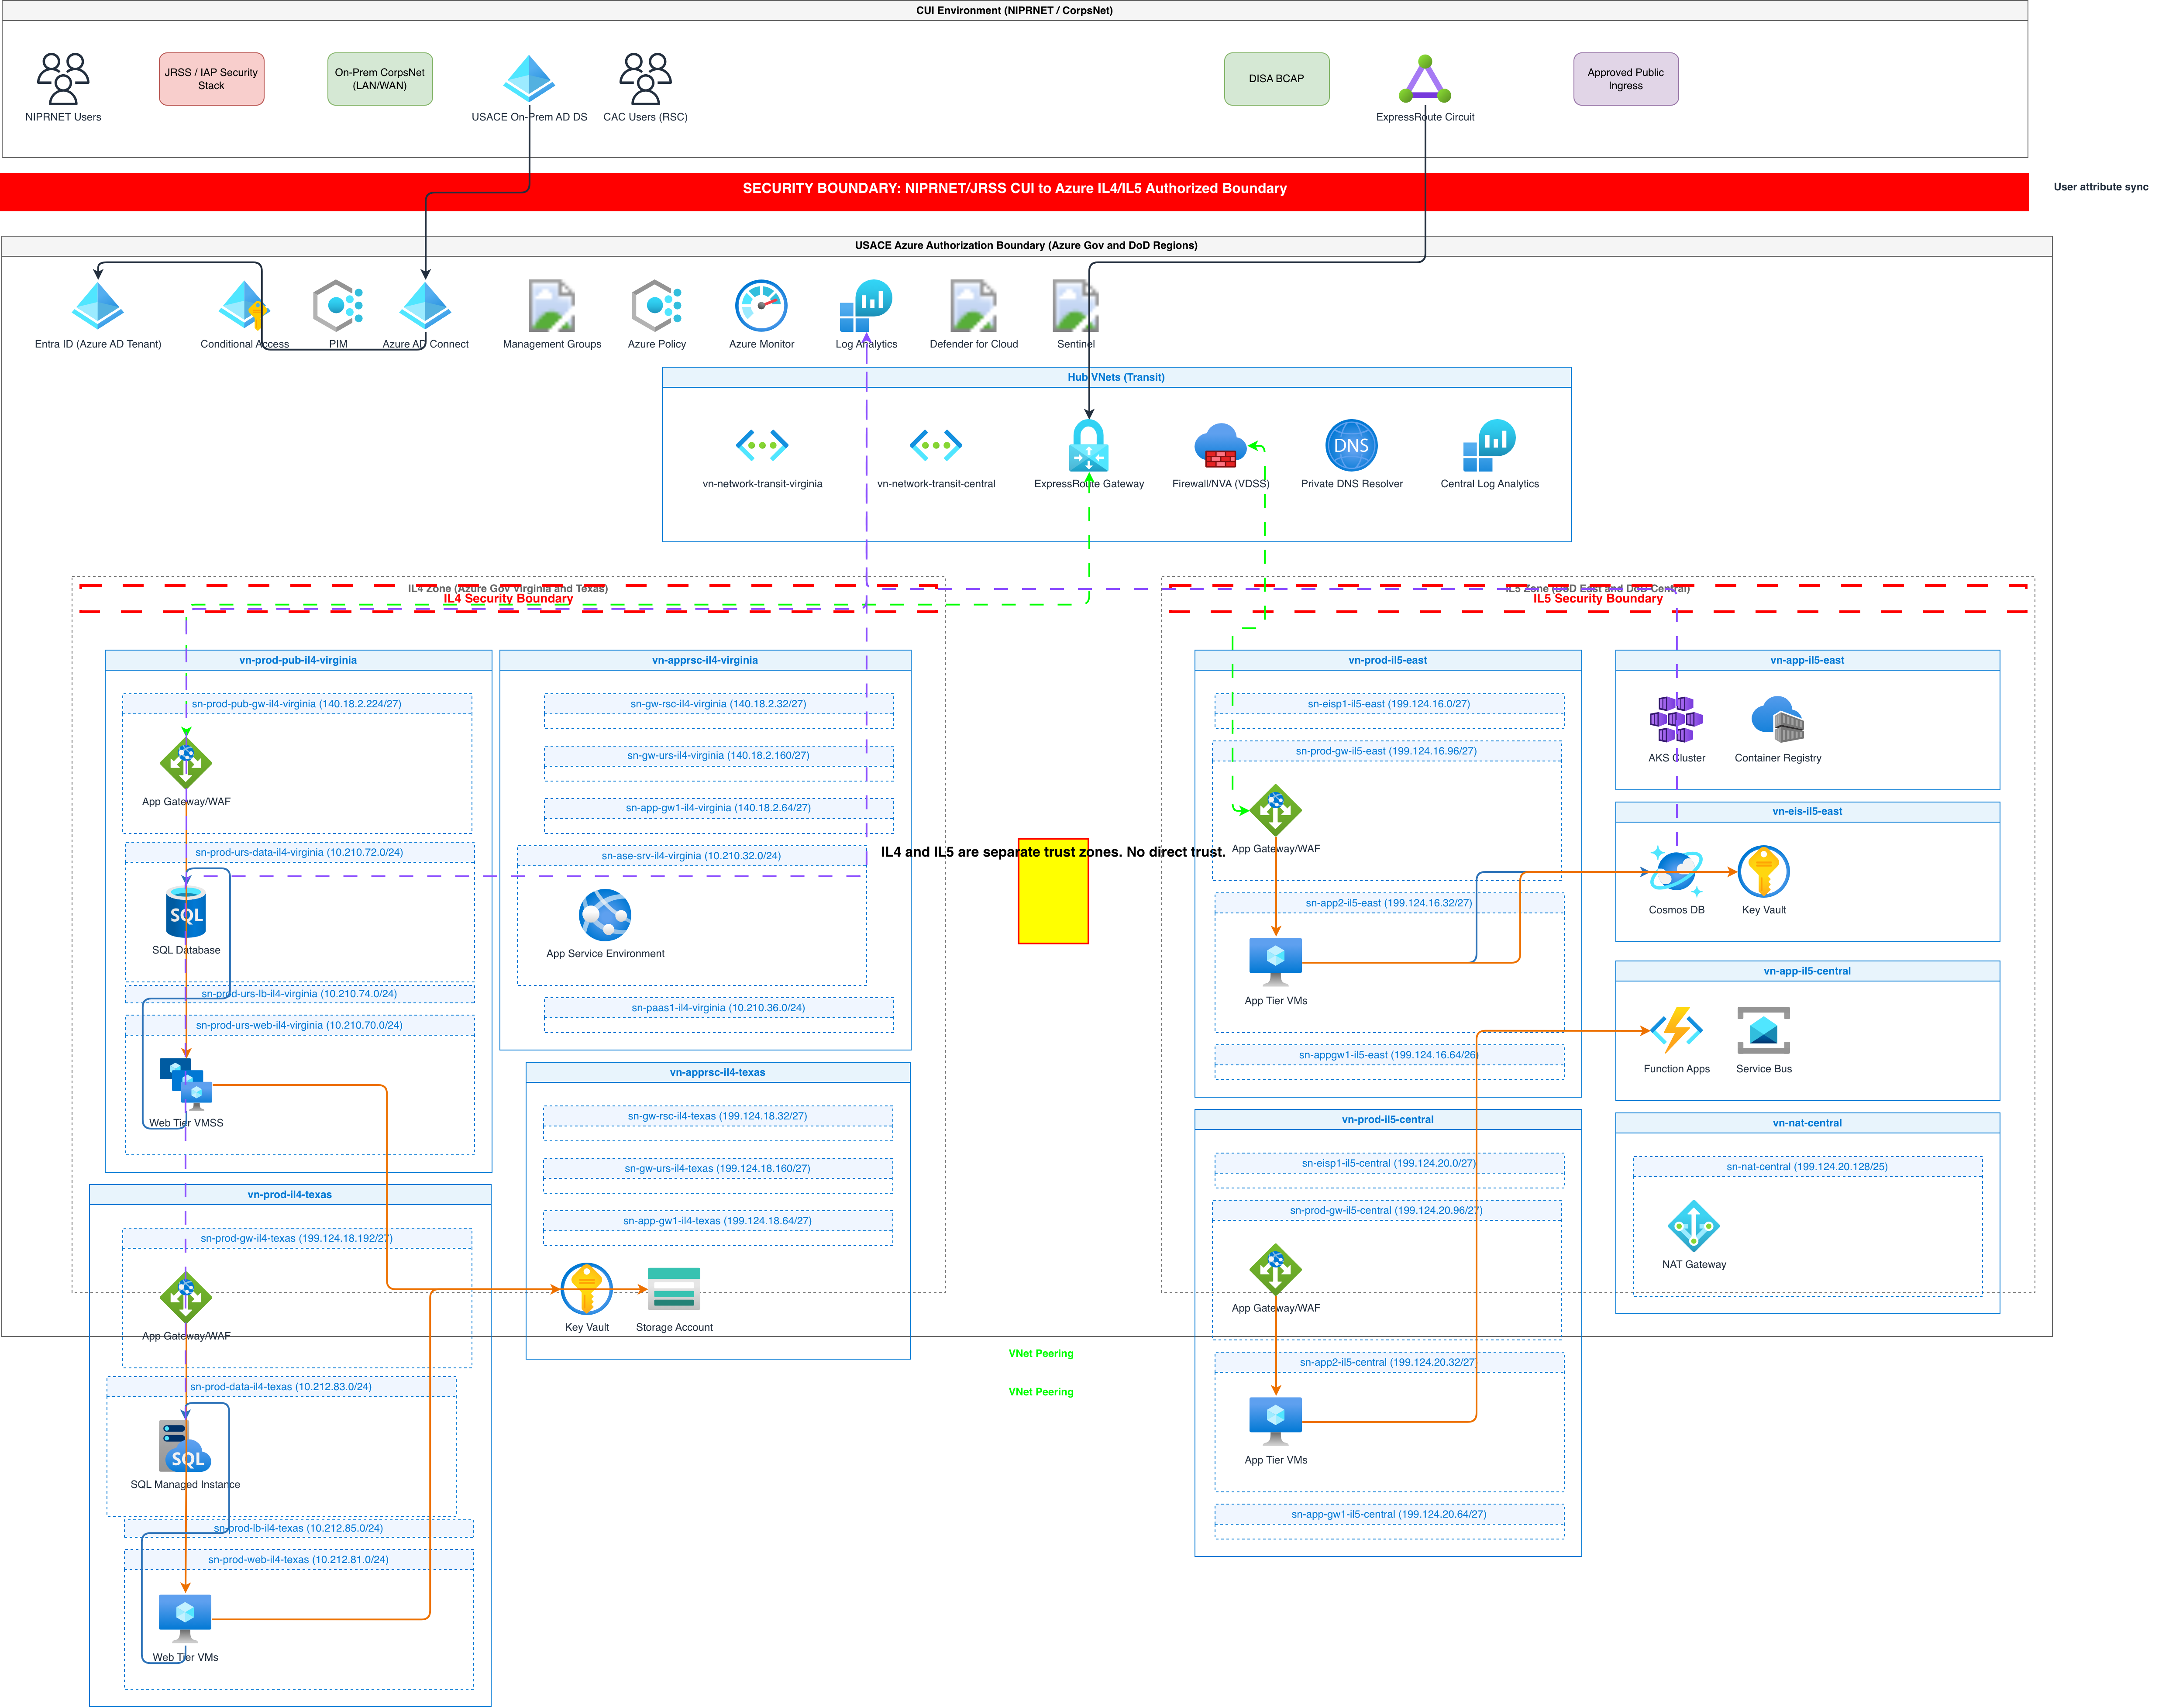

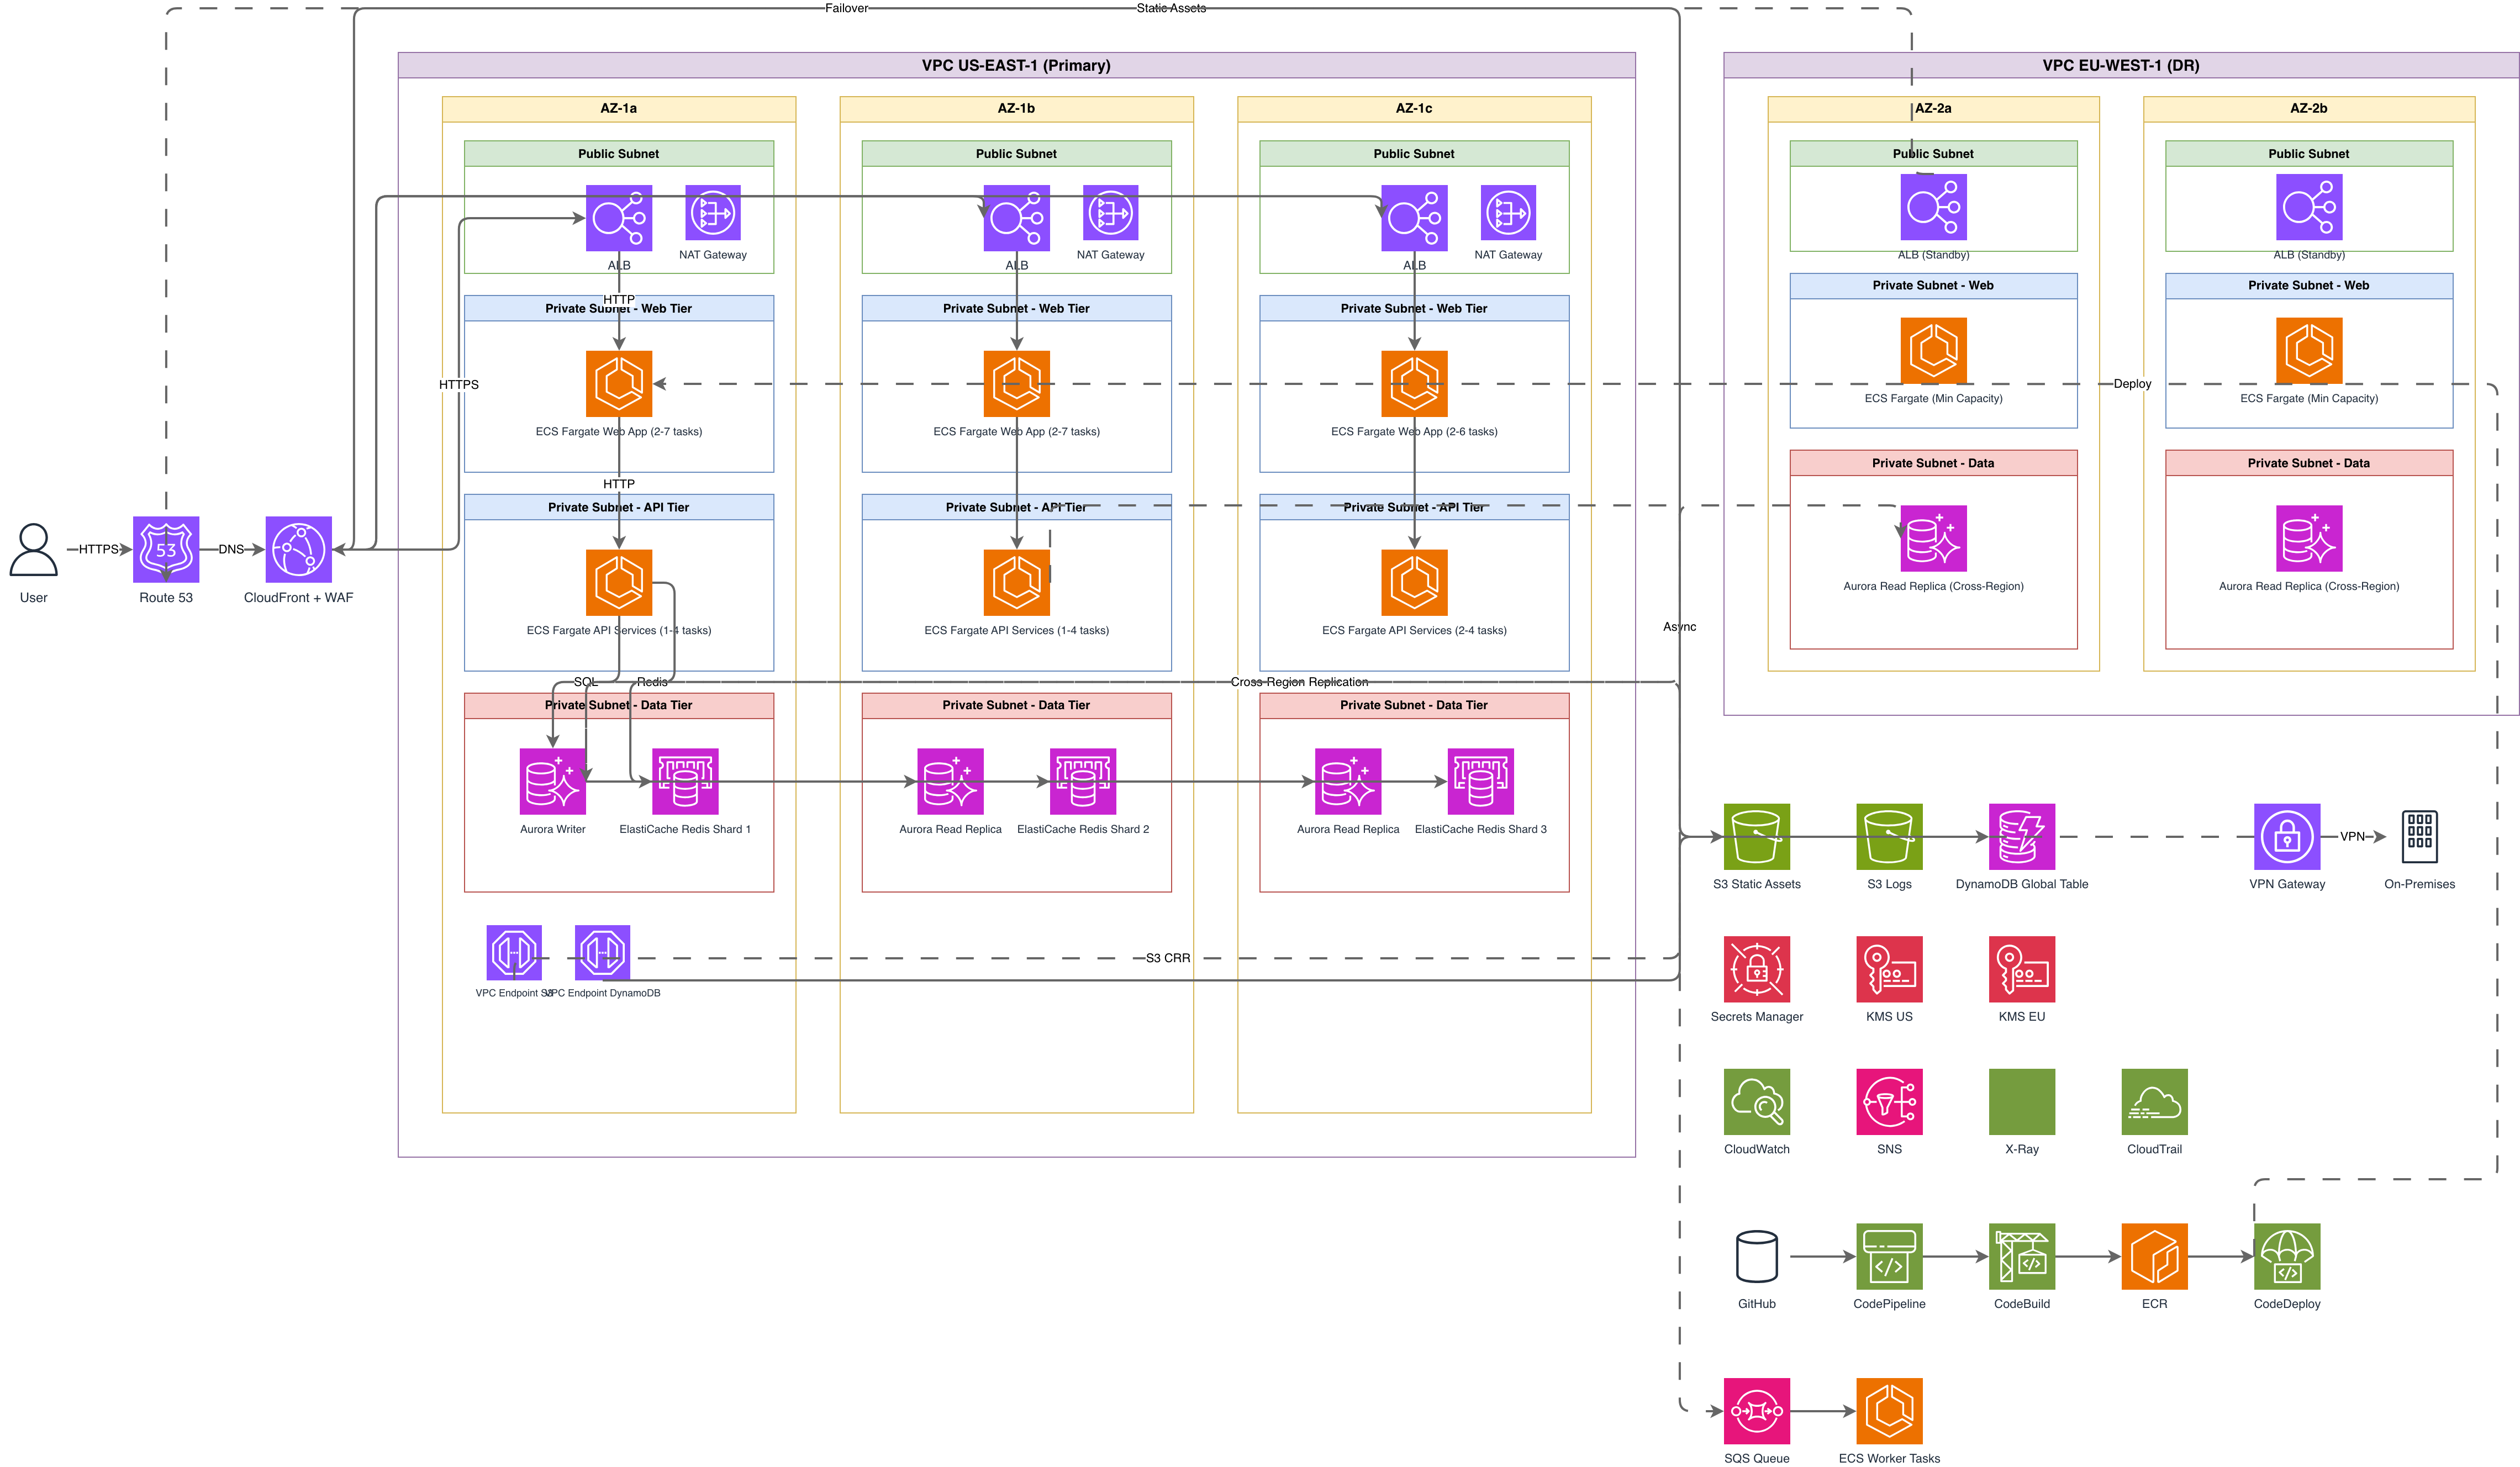
Generate these diagrams with AI
Make Any Diagram from Text with AI
Describe your system, process, or data flow in plain English. Get a valid Draw.io diagram with correct symbols, aligned nodes, and exportable .drawio XML.
Build Architecture Diagrams from Text Descriptions
Describe your cloud infrastructure or system design. Get a Draw.io architecture diagram with official vendor icons, VPC boundaries, and architecture warnings.
Generate Flowcharts from Text with AI
Describe a process in plain English. Get a valid Draw.io flowchart with correct ISO 5807 symbols, decision diamonds, and directional arrows.