Generate Flowcharts from Text with AI
Describe a process in plain English. Get a valid Draw.io flowchart with correct ISO 5807 symbols, decision diamonds, and directional arrows.
This AI flowchart generator converts plain-text process descriptions into Draw.io flowcharts with correct ISO 5807 symbols. You describe something like a user registration flow with email validation, OTP verification, and account activation. The AI parses your steps, selects terminators, process rectangles, decision diamonds, and directional arrows, then outputs a valid mxGraphModel XML file. Every node snaps to a 10px grid. You'll get architecture warnings if the flow has dead-end branches or unreachable nodes (WARN-05). The output opens directly in Draw.io, Confluence, or any tool that reads .drawio files. No drag-and-drop required. No manual alignment needed. Just text in, flowchart out.
What Is an AI Flowchart Generator?
A flowchart maps sequential steps, decision points, and parallel branches in a process. Traditional tools like Visio or Lucidchart require you to drag shapes onto a canvas, connect them manually, and align everything by hand. An AI flowchart generator replaces that entire workflow. You write a natural-language description. The AI selects the right ISO 5807 symbols: rounded rectangles for start/end terminators, rectangles for process steps, diamonds for yes/no decisions, parallelograms for input/output, and arrows for flow direction. Diagrams.so goes further than symbol selection. It applies BPMN 2.0 swim lanes when your description involves multiple actors or departments. It groups related steps into subprocesses automatically. It enforces left-to-right layout by default, following RULE-05, so the diagram reads like a sentence. Opinionated mode locks the layout to prevent manual overrides that break readability. The AI runs VLM visual validation after generation to catch overlapping labels or crossing arrows that a pure syntax check would miss. You get architecture warnings for ambiguous components (WARN-05) or missing security boundaries (WARN-04). The output is native .drawio XML, not a proprietary format. Open it in Draw.io, export to PNG or SVG, or embed it directly in Confluence. Skip Visio for this. The .drawio format is portable, version-controllable, and free.
Key components
- ISO 5807 terminators (rounded rectangles) for start and end nodes
- Decision diamonds with labeled yes/no branches and guard conditions
- BPMN 2.0 swim lanes for multi-actor processes like approval workflows
- Subprocess grouping with expandable containers for nested logic
- Directional arrows with labels showing data passed between steps
- Parallel gateway bars for concurrent execution paths (fork/join)
- Input/output parallelograms for user prompts, API responses, and file reads
- Color-coded risk indicators tied to architecture warnings WARN-01 through WARN-05
How to generate with AI
- 1
Describe the process
Write your flow in plain English. Be specific about decision points and their outcomes. For example: 'User submits login form. If credentials are valid, generate JWT and redirect to dashboard. If invalid, increment failure counter. After 5 failures, lock the account and send a notification email to the admin.' Include actors if you want swim lanes.
- 2
Select flowchart type and options
Choose 'Flowchart' as the diagram type. Pick a cloud provider if the flow involves infrastructure components like AWS Step Functions or Azure Logic Apps. Diagrams.so loads the matching icon library from its 30+ available sets. Enable opinionated mode if you want the AI to enforce strict left-to-right layout and auto-group related steps.
- 3
Generate and export
Click generate. The AI produces a .drawio XML file with grid-aligned shapes, labeled arrows, and decision branches. VLM visual validation flags overlapping elements. Architecture warnings call out dead-end paths or ambiguous steps. Download as .drawio to edit further, or export directly to PNG or SVG. The file opens in Draw.io desktop, draw.io VS Code extension, or Confluence without conversion.
Example prompt
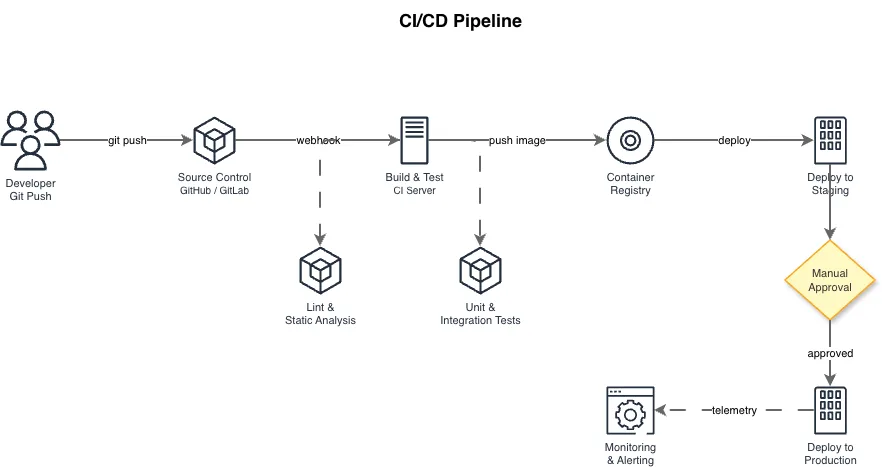
CI/CD deployment pipeline: developer pushes to main branch, GitHub Actions triggers build. If unit tests pass, run integration tests. If integration tests pass, build Docker image and push to ECR. Deploy to staging ECS cluster. Run smoke tests. If smoke tests pass, prompt for manual approval. On approval, deploy to production ECS cluster with blue-green strategy. If any test stage fails, send Slack notification to #deployments channel and halt the pipeline. Include rollback path from production if health checks fail within 10 minutes.
Example diagrams from the gallery


Flowchart vs Activity Diagram vs Data Flow Diagram
These three diagram types overlap but serve different purposes. Flowcharts show sequential process logic. Activity diagrams add UML-specific constructs for concurrency and object flow. Data flow diagrams ignore control flow entirely and focus on how data moves between processes and stores.
| Feature | Flowchart | Activity Diagram | Data Flow Diagram |
|---|---|---|---|
| Primary purpose | Map sequential steps and yes/no decision branches in a process | Model concurrent workflows with UML fork/join bars and object nodes | Track data movement between external entities, processes, and data stores |
| Decision representation | Diamonds with labeled yes/no exit arrows per ISO 5807 | UML decision nodes with guard conditions in square brackets like [amount > 100] | No decision symbols; processes are black boxes that transform data |
| Concurrency support | Parallel bars (fork/join) optional and rarely used in basic flowcharts | First-class fork/join bars with synchronization semantics defined in UML 2.5 | Implicit parallelism; multiple data flows can enter a process simultaneously |
| Standard notation | ISO 5807:1985 defines terminators, processes, decisions, and I/O shapes | UML 2.5 specification with activity partitions (swim lanes) and pins | Yourdon-DeMarco (circles for processes) or Gane-Sarson (rounded rectangles) |
| Data visibility | Arrow labels can show data but it's not the primary focus | Object nodes and object flows show data tokens moving between actions | Core purpose; every arrow is a named data flow with defined content |
| Best suited for | Login flows, approval chains, troubleshooting guides, onboarding steps | Order processing with parallel fulfillment, multi-department workflows | System context diagrams, ETL pipelines, API data mapping between services |
When to use this pattern
Use a flowchart when your audience needs to follow a single path through a process with clear decision points. Onboarding checklists, incident response runbooks, and feature flag evaluation logic are good candidates. If your process involves multiple actors doing work simultaneously, consider an activity diagram with swim lanes instead. If you care more about what data moves where than the order of operations, a data flow diagram fits better. Flowcharts work best when the process has fewer than 20 steps. Beyond that, break it into subprocesses or use a hierarchical flowchart. Don't force a flowchart onto event-driven architectures. Use sequence diagrams for message passing between services.
Frequently asked questions
What input format does the AI flowchart generator accept?
Plain English text up to 5,000 characters. This AI flowchart generator doesn't require formal notation or structured syntax. Describe steps sequentially and specify decision outcomes explicitly, like 'if payment fails, retry three times then notify support.' The AI maps your text to ISO 5807 symbols automatically. Voice-to-diagram input is also available for hands-free descriptions.
Can I add swim lanes to my flowchart?
Yes. Mention the actors or departments in your prompt. For example, 'Customer submits order, Warehouse picks items, Finance processes payment.' The AI creates BPMN 2.0 swim lanes and assigns each step to the correct lane. Each lane gets a labeled header.
What file formats can I export?
Native .drawio XML is the default output. You can also export to PNG and SVG directly from Diagrams.so. The .drawio file opens in Draw.io desktop, the VS Code extension, Confluence, and any editor supporting mxGraphModel XML. No format conversion needed.
How does the AI handle errors in my process description?
Architecture warnings flag problems without blocking generation. WARN-05 catches ambiguous components that need clarification. Dead-end branches and unreachable nodes get called out explicitly in the warning panel. VLM visual validation then detects overlapping labels or crossing arrows after the diagram renders, so you catch both logical and visual issues.
Is there a limit on flowchart complexity?
The 5,000-character prompt limit is the practical constraint. That's typically enough for 30 to 40 process steps with decision branches and annotations. For larger processes, break them into named subprocesses and generate each one separately. Link the resulting diagrams using off-page connectors in Draw.io to maintain traceability.
Related diagram generators
Generate Sequence Diagrams from Text with AI
Describe interactions between services or actors. Get a valid Draw.io sequence diagram with UML 2.5 lifelines, activation bars, and message arrows.
Generate Data Flow Diagrams from Text with AI
Describe how data moves through your system. Get a valid Draw.io DFD with Yourdon-DeMarco notation, decomposition levels, and named data flows.
Generate UML Diagrams from Text with AI
Describe your classes, components, or deployment topology in plain English. Get a valid Draw.io UML diagram with correct UML 2.5 notation and relationships.
Generate CI/CD Pipeline Diagrams from Text with AI
Describe your build, test, and deploy stages in plain English. Get a valid Draw.io pipeline diagram with parallel jobs, approval gates, and rollback paths.