Generate AWS architecture diagrams from text
Describe your AWS infrastructure in plain English. Get a valid Draw.io diagram with official AWS icons, VPC boundaries, and Multi-AZ placement.
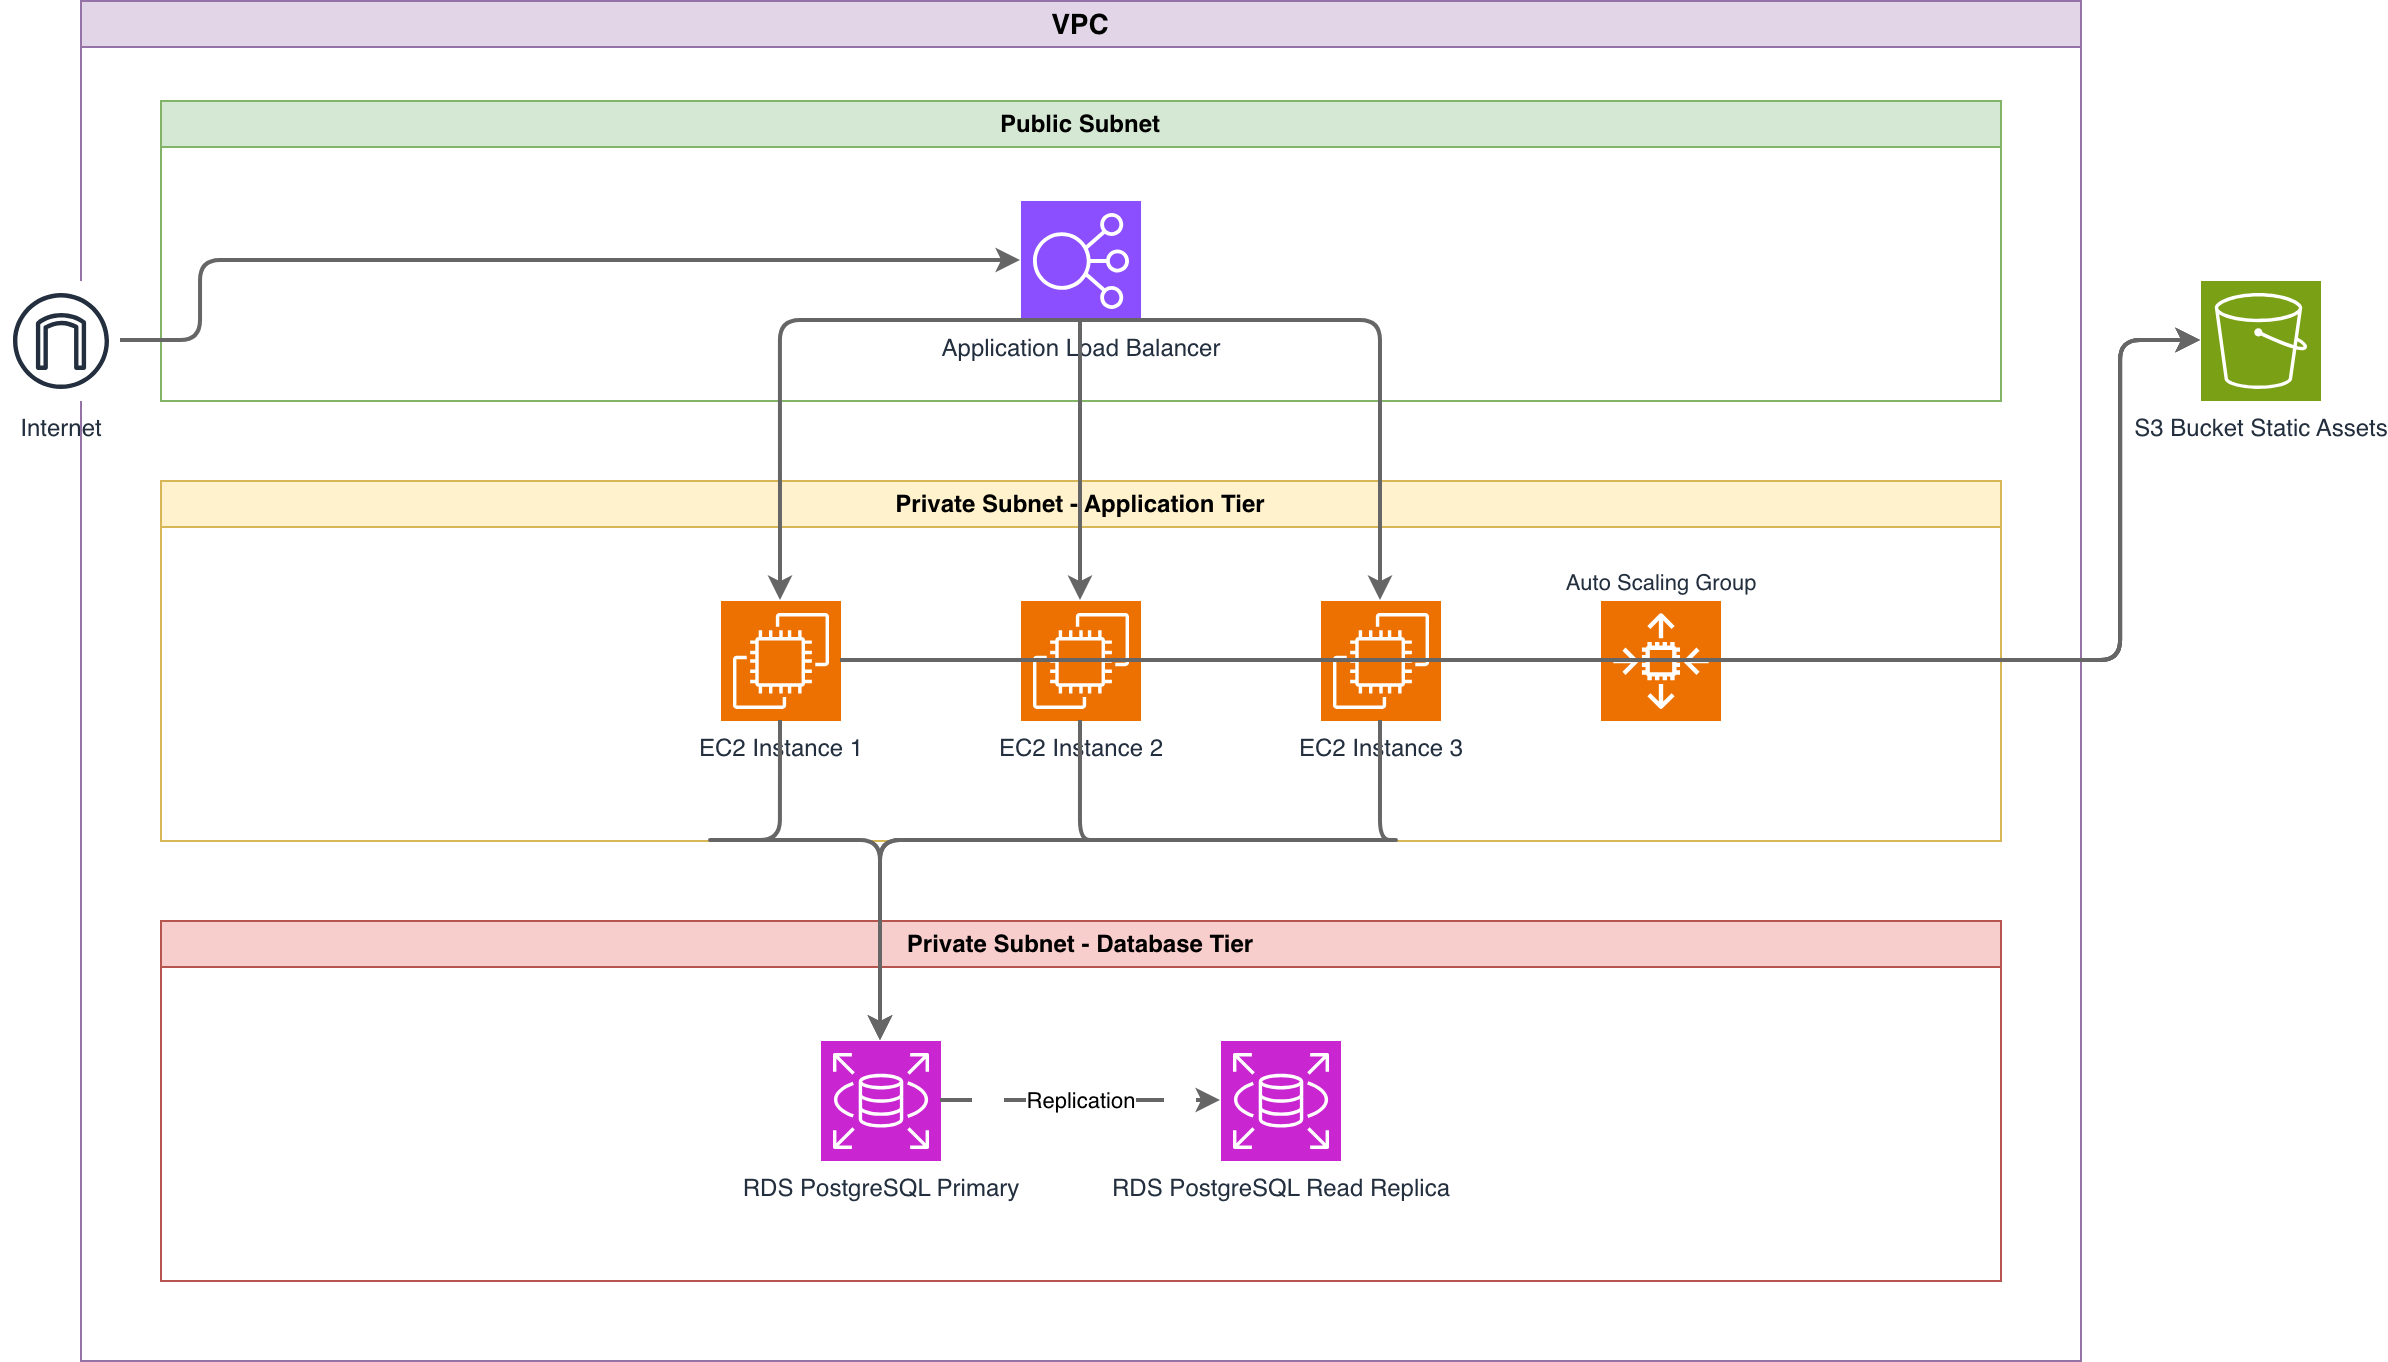
This AI AWS architecture diagram generator converts plain-text infrastructure descriptions into Draw.io diagrams with official AWS 2024 icon sets. Describe a setup like an ALB fronting an EC2 Auto Scaling group across us-east-1a and us-east-1b, with RDS PostgreSQL Multi-AZ and an ElastiCache Redis cluster in private subnets. The AI maps each service to its official icon, draws VPC boundaries with 10.0.0.0/16 CIDR notation, places subnets in the correct availability zones, and outputs valid mxGraphModel XML. Architecture warnings flag single-AZ deployments (WARN-01) and public endpoints without WAF (WARN-02). Every element snaps to a 10px grid. The output opens directly in Draw.io with no conversion needed.
What Is an AI AWS Architecture Diagram Generator?
An AWS architecture diagram maps your cloud infrastructure: VPCs, subnets, EC2 instances, managed services, and the network paths between them. Drawing these manually in Visio or Lucidchart means hunting for the right AWS icon, dragging it onto a canvas, connecting it with arrows, and aligning everything by hand. An AI AWS architecture diagram generator eliminates that process. You write a natural-language description of your infrastructure. The AI identifies each AWS service, selects the correct icon from the official AWS Architecture Icon set, and positions components within proper VPC and subnet boundaries. Diagrams.so enforces AZ-aware layouts. When you mention RDS Multi-AZ, the AI places primary and standby instances in separate availability zones with a synchronous replication arrow between them. Security groups appear as dashed boundaries around grouped resources. NACLs get their own visual layer at the subnet level. The generator applies RULE-02 to use only official AWS icons, never generic shapes. RULE-06 groups related components: an ALB with its target group, an ECS cluster with its task definitions and services. Architecture warnings catch real problems. WARN-01 flags single-AZ deployments. WARN-02 identifies public-facing ALBs or API Gateways without AWS WAF. WARN-03 catches RDS instances without read replicas. VLM visual validation runs after generation to detect overlapping icons or illegible labels. The output is native .drawio XML. Open it in Draw.io, commit it to Git, or embed it in Confluence. No proprietary format lock-in.
Key components
- VPC boundaries with CIDR notation (10.0.0.0/16) and subnet segmentation across AZs
- Official AWS 2024 Architecture Icons for 200+ services including ALB, EC2, RDS, S3, Lambda
- Availability Zone columns showing resource placement in us-east-1a, us-east-1b, us-east-1c
- Security group dashed boundaries grouping EC2 instances, RDS, and ElastiCache clusters
- Auto Scaling group indicators with min/max/desired capacity annotations
- Data flow arrows distinguishing public traffic (CloudFront to ALB) from private traffic (app to RDS)
- IAM role associations shown as dotted lines from Lambda functions and ECS tasks to their execution roles
- Architecture warnings for single-AZ (WARN-01), missing WAF (WARN-02), and no DB replica (WARN-03)
How to generate with AI
- 1
Describe your AWS infrastructure
Write your architecture in plain English. Be specific about services, regions, and network topology. For example: 'Three-tier web app in us-east-1. CloudFront distribution pointing to an ALB in a public subnet. ALB routes to an ECS Fargate service running in private subnets across two AZs. Backend connects to RDS PostgreSQL Multi-AZ in isolated subnets and ElastiCache Redis for session caching. S3 bucket for static assets with CloudFront origin access control.' Include CIDR ranges if you want them on the diagram.
- 2
Select diagram type and cloud provider
Choose 'Architecture' as the diagram type and 'AWS' as the cloud provider. Diagrams.so loads the official AWS icon library with 200+ service icons. Enable opinionated mode to enforce AZ-column layout and automatic security group boundaries. The AI follows RULE-02 for official icons and RULE-05 for left-to-right layout by default.
- 3
Generate and validate
Click generate. The AI produces .drawio XML with VPC boundaries, subnet divisions, AZ columns, and labeled arrows showing traffic flow. Architecture warnings flag single-AZ deployments (WARN-01), public endpoints without WAF (WARN-02), and databases without replicas (WARN-03). VLM visual validation catches overlapping icons. Download as .drawio for editing, or export to PNG or SVG for documentation.
Example prompt
Production three-tier architecture in AWS us-east-1. CloudFront distribution with WAF v2 in front. Application Load Balancer in public subnets across us-east-1a and us-east-1b. ECS Fargate cluster running in private subnets with auto scaling (min 2, max 10 tasks). RDS PostgreSQL 15 Multi-AZ in isolated subnets with automated backups to S3. ElastiCache Redis 7 cluster with 2 read replicas for session management. S3 bucket for static assets with origin access control to CloudFront. NAT Gateways in each public subnet for outbound traffic from private subnets. Route 53 hosted zone with alias record pointing to CloudFront. VPC CIDR 10.0.0.0/16. Public subnets 10.0.1.0/24 and 10.0.2.0/24. Private subnets 10.0.10.0/24 and 10.0.20.0/24. Isolated subnets 10.0.100.0/24 and 10.0.200.0/24.
Example diagrams from the gallery


AWS Architecture Diagram vs Azure Architecture Diagram vs GCP Architecture Diagram
All three cloud providers need architecture diagrams, but their networking models, naming conventions, and icon sets differ significantly. AWS uses VPCs with availability zones. Azure uses VNets with resource groups. GCP uses VPCs with regions and zones as flat network constructs. The diagram structure follows each provider's topology.
| Feature | AWS Architecture Diagram | Azure Architecture Diagram | GCP Architecture Diagram |
|---|---|---|---|
| Network boundary model | VPC with CIDR, public/private subnets per AZ, internet and NAT gateways | VNet with address spaces, subnets not tied to zones, NSGs attached to subnets or NICs | VPC is global, subnets are regional (not zonal), firewall rules at VPC level |
| Availability model | Resources placed in specific AZs (us-east-1a, us-east-1b); Multi-AZ is explicit | Availability Zones numbered 1-3; availability sets for older VM placement | Zones within regions (us-central1-a); managed instance groups handle distribution |
| Icon set standard | AWS Architecture Icons 2024 with 200+ service icons in SVG format | Microsoft Azure Icon Set with resource-type-specific icons and color coding | Google Cloud Icons with product-line color grouping (blue for compute, green for networking) |
| Load balancer representation | ALB, NLB, or GLB as distinct icons with listener rules and target groups | Azure Load Balancer (L4) or Application Gateway (L7) with backend pools | Cloud Load Balancing as a single service with global or regional scope |
| Security boundary visualization | Security groups as dashed boundaries around instances; NACLs at subnet level | NSGs shown at subnet or NIC level; Azure Firewall as a central hub icon | Firewall rules at VPC level with priority numbers; no per-instance groups |
| Typical use case | Multi-AZ web apps, serverless APIs with Lambda + API Gateway, ECS/EKS clusters | Enterprise hybrid with ExpressRoute, App Service environments, Azure AD integration | Data-intensive workloads with BigQuery, GKE clusters, Cloud Run services |
When to use this pattern
Use an AWS architecture diagram when you need to document VPC topology, plan a migration, or present infrastructure to stakeholders who need to see specific AWS services and their connections. It's the right choice for documenting three-tier web applications, serverless APIs with Lambda and API Gateway, or ECS/EKS container platforms. If your infrastructure spans multiple cloud providers, start with individual provider diagrams and compose them into a multi-cloud overview. Don't use an AWS architecture diagram for application logic or data flow; use sequence diagrams or data flow diagrams for those. Keep diagrams focused on one VPC or one application stack to avoid visual clutter.
Frequently asked questions
Does the AI AWS architecture diagram generator use official AWS icons?
Yes. This AI AWS architecture diagram generator uses the official AWS Architecture Icons 2024 set with 200+ service icons. RULE-02 enforces official cloud provider icons for every service. You'll get the correct icon for ALB, EC2, RDS, Lambda, S3, CloudFront, and every other AWS service in the library. No generic shapes or placeholders.
How does the AI handle Multi-AZ deployments?
When your prompt mentions Multi-AZ or specifies availability zones, the AI creates AZ columns and places resources accordingly. RDS Multi-AZ gets primary and standby instances in separate zones with replication arrows. If you describe a single-AZ setup, architecture warning WARN-01 flags it as a reliability risk.
Can I specify VPC CIDR ranges and subnet layouts?
Yes. Include CIDR notation in your prompt like '10.0.0.0/16 VPC with 10.0.1.0/24 public subnet.' The AI adds CIDR labels to VPC and subnet boundaries in the diagram. If you omit CIDRs, the AI generates the diagram without them. You can always add them later in Draw.io.
What architecture warnings apply to AWS diagrams?
Five warnings apply. WARN-01 catches single-AZ deployments. WARN-02 flags public endpoints like ALBs or API Gateways without WAF. WARN-03 identifies databases without read replicas. WARN-04 detects missing security boundaries. WARN-05 flags ambiguous components that need clarification. Warnings don't block generation; they appear as annotations.
Can I generate diagrams for AWS serverless architectures?
Yes. Describe your Lambda functions, API Gateway endpoints, DynamoDB tables, SQS queues, and Step Functions state machines. The AI uses the correct icon for each service and draws event-driven connections with labeled arrows showing triggers and payloads. Opinionated mode enforces clean left-to-right flow for serverless event chains.
Related diagram generators
Generate Azure Architecture Diagrams from Text with AI
Describe your Azure infrastructure in plain English. Get a valid Draw.io diagram with official Azure icons, VNet boundaries, resource groups, and NSG rules.
Generate GCP Architecture Diagrams from Text
Describe your Google Cloud infrastructure in plain English. Get a valid Draw.io diagram with official GCP icons, project boundaries, and VPC networking.
Generate Cloud Architecture Diagrams from Text
Describe your cloud infrastructure in plain English. Get a valid Draw.io diagram with region boundaries, availability zones, managed services, and DR paths.
Generate Kubernetes Diagrams from Text with AI
Describe your Kubernetes cluster in plain English. Get a valid Draw.io diagram with CNCF icons, namespace boundaries, deployments, services, and ingress controllers.