Build Architecture Diagrams from Text Descriptions
Describe your cloud infrastructure or system design. Get a Draw.io architecture diagram with official vendor icons, VPC boundaries, and architecture warnings.
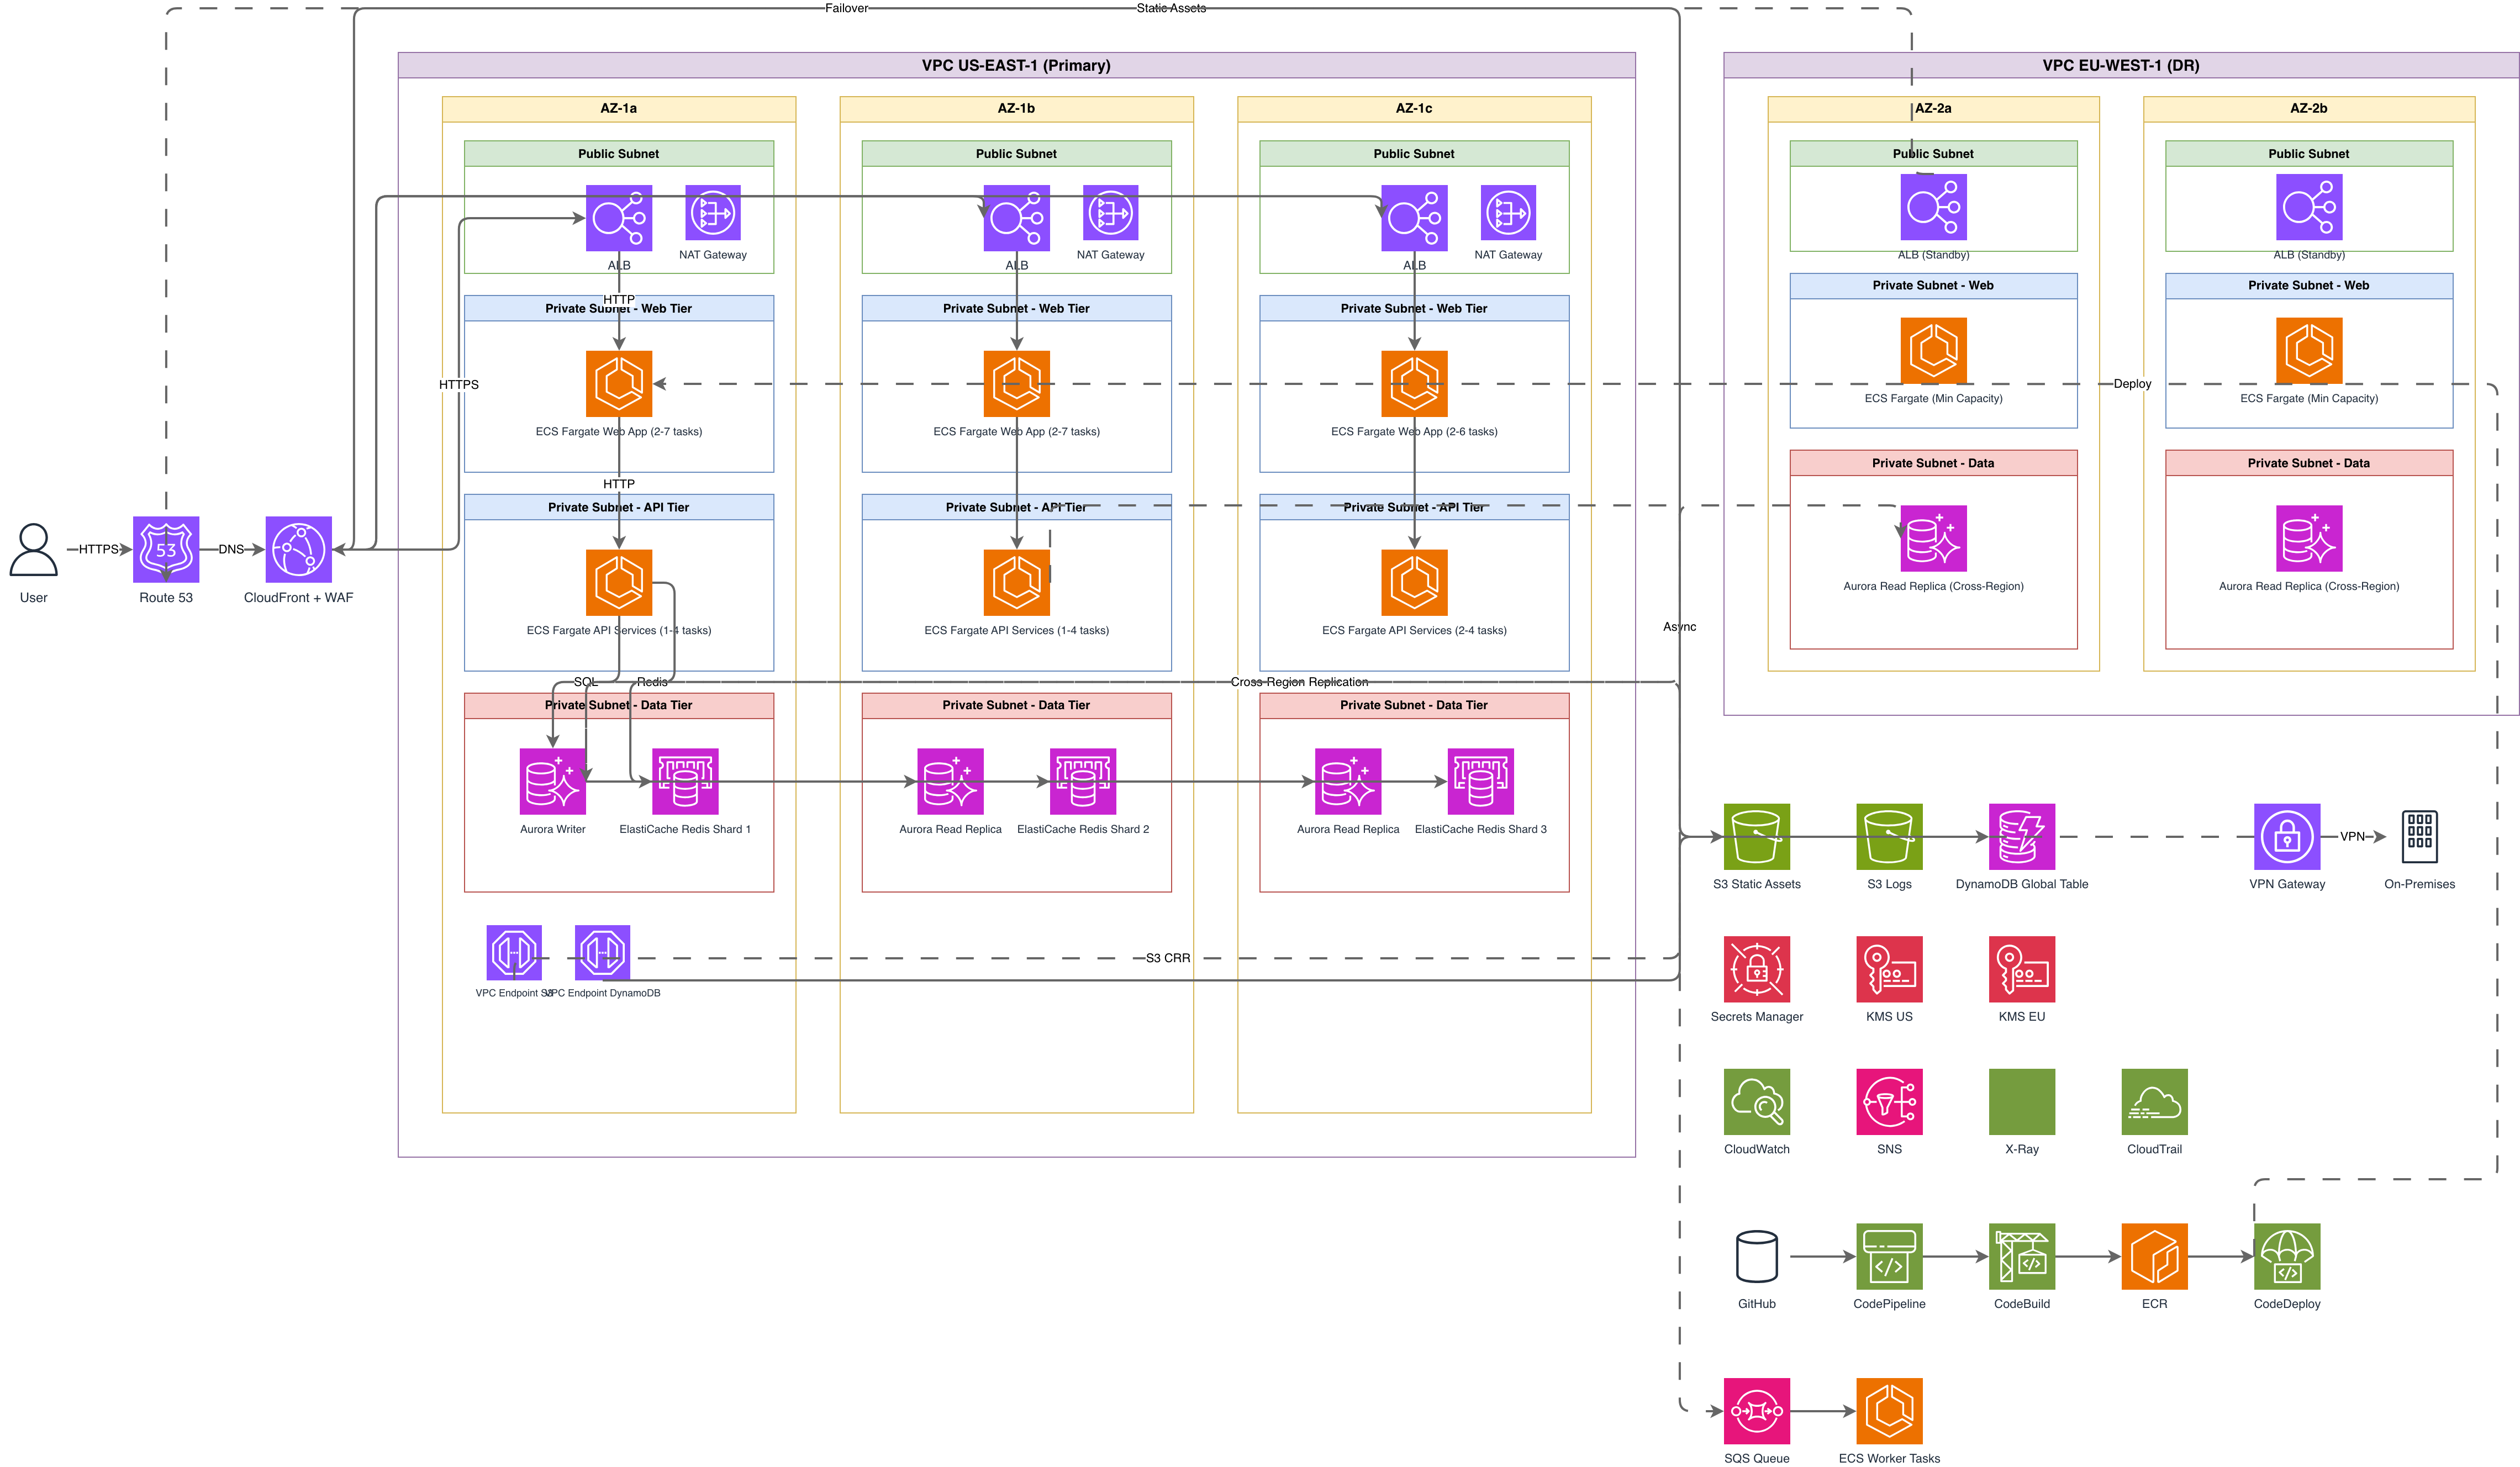
This architecture diagram tool generates Draw.io architecture diagrams from text descriptions of cloud infrastructure and system designs. Write 'three-tier app on AWS: CloudFront, ALB in public subnet, ECS Fargate in private subnet, Aurora PostgreSQL Multi-AZ in data subnet, all inside a VPC with NAT Gateway.' The AI selects official AWS icons, draws VPC and subnet boundaries, places services in the correct network zones, and outputs valid mxGraphModel XML. Architecture warnings run automatically: WARN-01 if you described a single availability zone, WARN-02 if the ALB faces the internet without WAF mention, WARN-03 if the database lacks a read replica. VLM visual validation catches overlapping service labels and tangled connectors. Download as .drawio, PNG, or SVG. The diagram opens in Draw.io, Confluence, or VS Code without conversion.
What Is an Architecture Diagram Tool?
An architecture diagram tool creates visual representations of system infrastructure: servers, databases, networks, message queues, CDNs, and the connections between them. These diagrams appear in design documents, architecture decision records, runbooks, and stakeholder presentations. The traditional workflow involves opening Draw.io, Lucidchart, or Visio, searching for the right cloud provider icon stencil, dragging services onto the canvas, drawing connectors, creating VPC boundary boxes, labeling subnets, and aligning everything by hand. A 20-service architecture takes 45 minutes to diagram manually. Changes mean rearranging half the canvas. An AI-powered architecture diagram tool replaces that workflow with text input. Diagrams.so parses your description and produces a diagram that follows architectural conventions automatically. RULE-02 ensures every cloud service gets its official vendor icon. Write 'RDS PostgreSQL Multi-AZ' and you get the RDS icon with a Multi-AZ annotation, not a generic cylinder. RULE-06 groups related services: an ECS cluster with three task definitions appears inside a labeled container. RULE-05 enforces left-to-right layout so the diagram reads naturally from client to database. Five architecture warnings provide design review feedback that no manual tool offers. WARN-01 catches single-AZ risk. WARN-02 flags public endpoints without WAF. WARN-03 identifies databases without replicas. WARN-04 spots missing security boundaries like a service sitting outside the VPC. WARN-05 marks components where your description was too vague for the AI to select a specific service. After generation, VLM visual validation renders the diagram and checks for visual defects that XML-level checks can't catch.
Key components
- Official cloud provider icons for AWS, Azure, GCP, and Kubernetes from 30+ built-in libraries
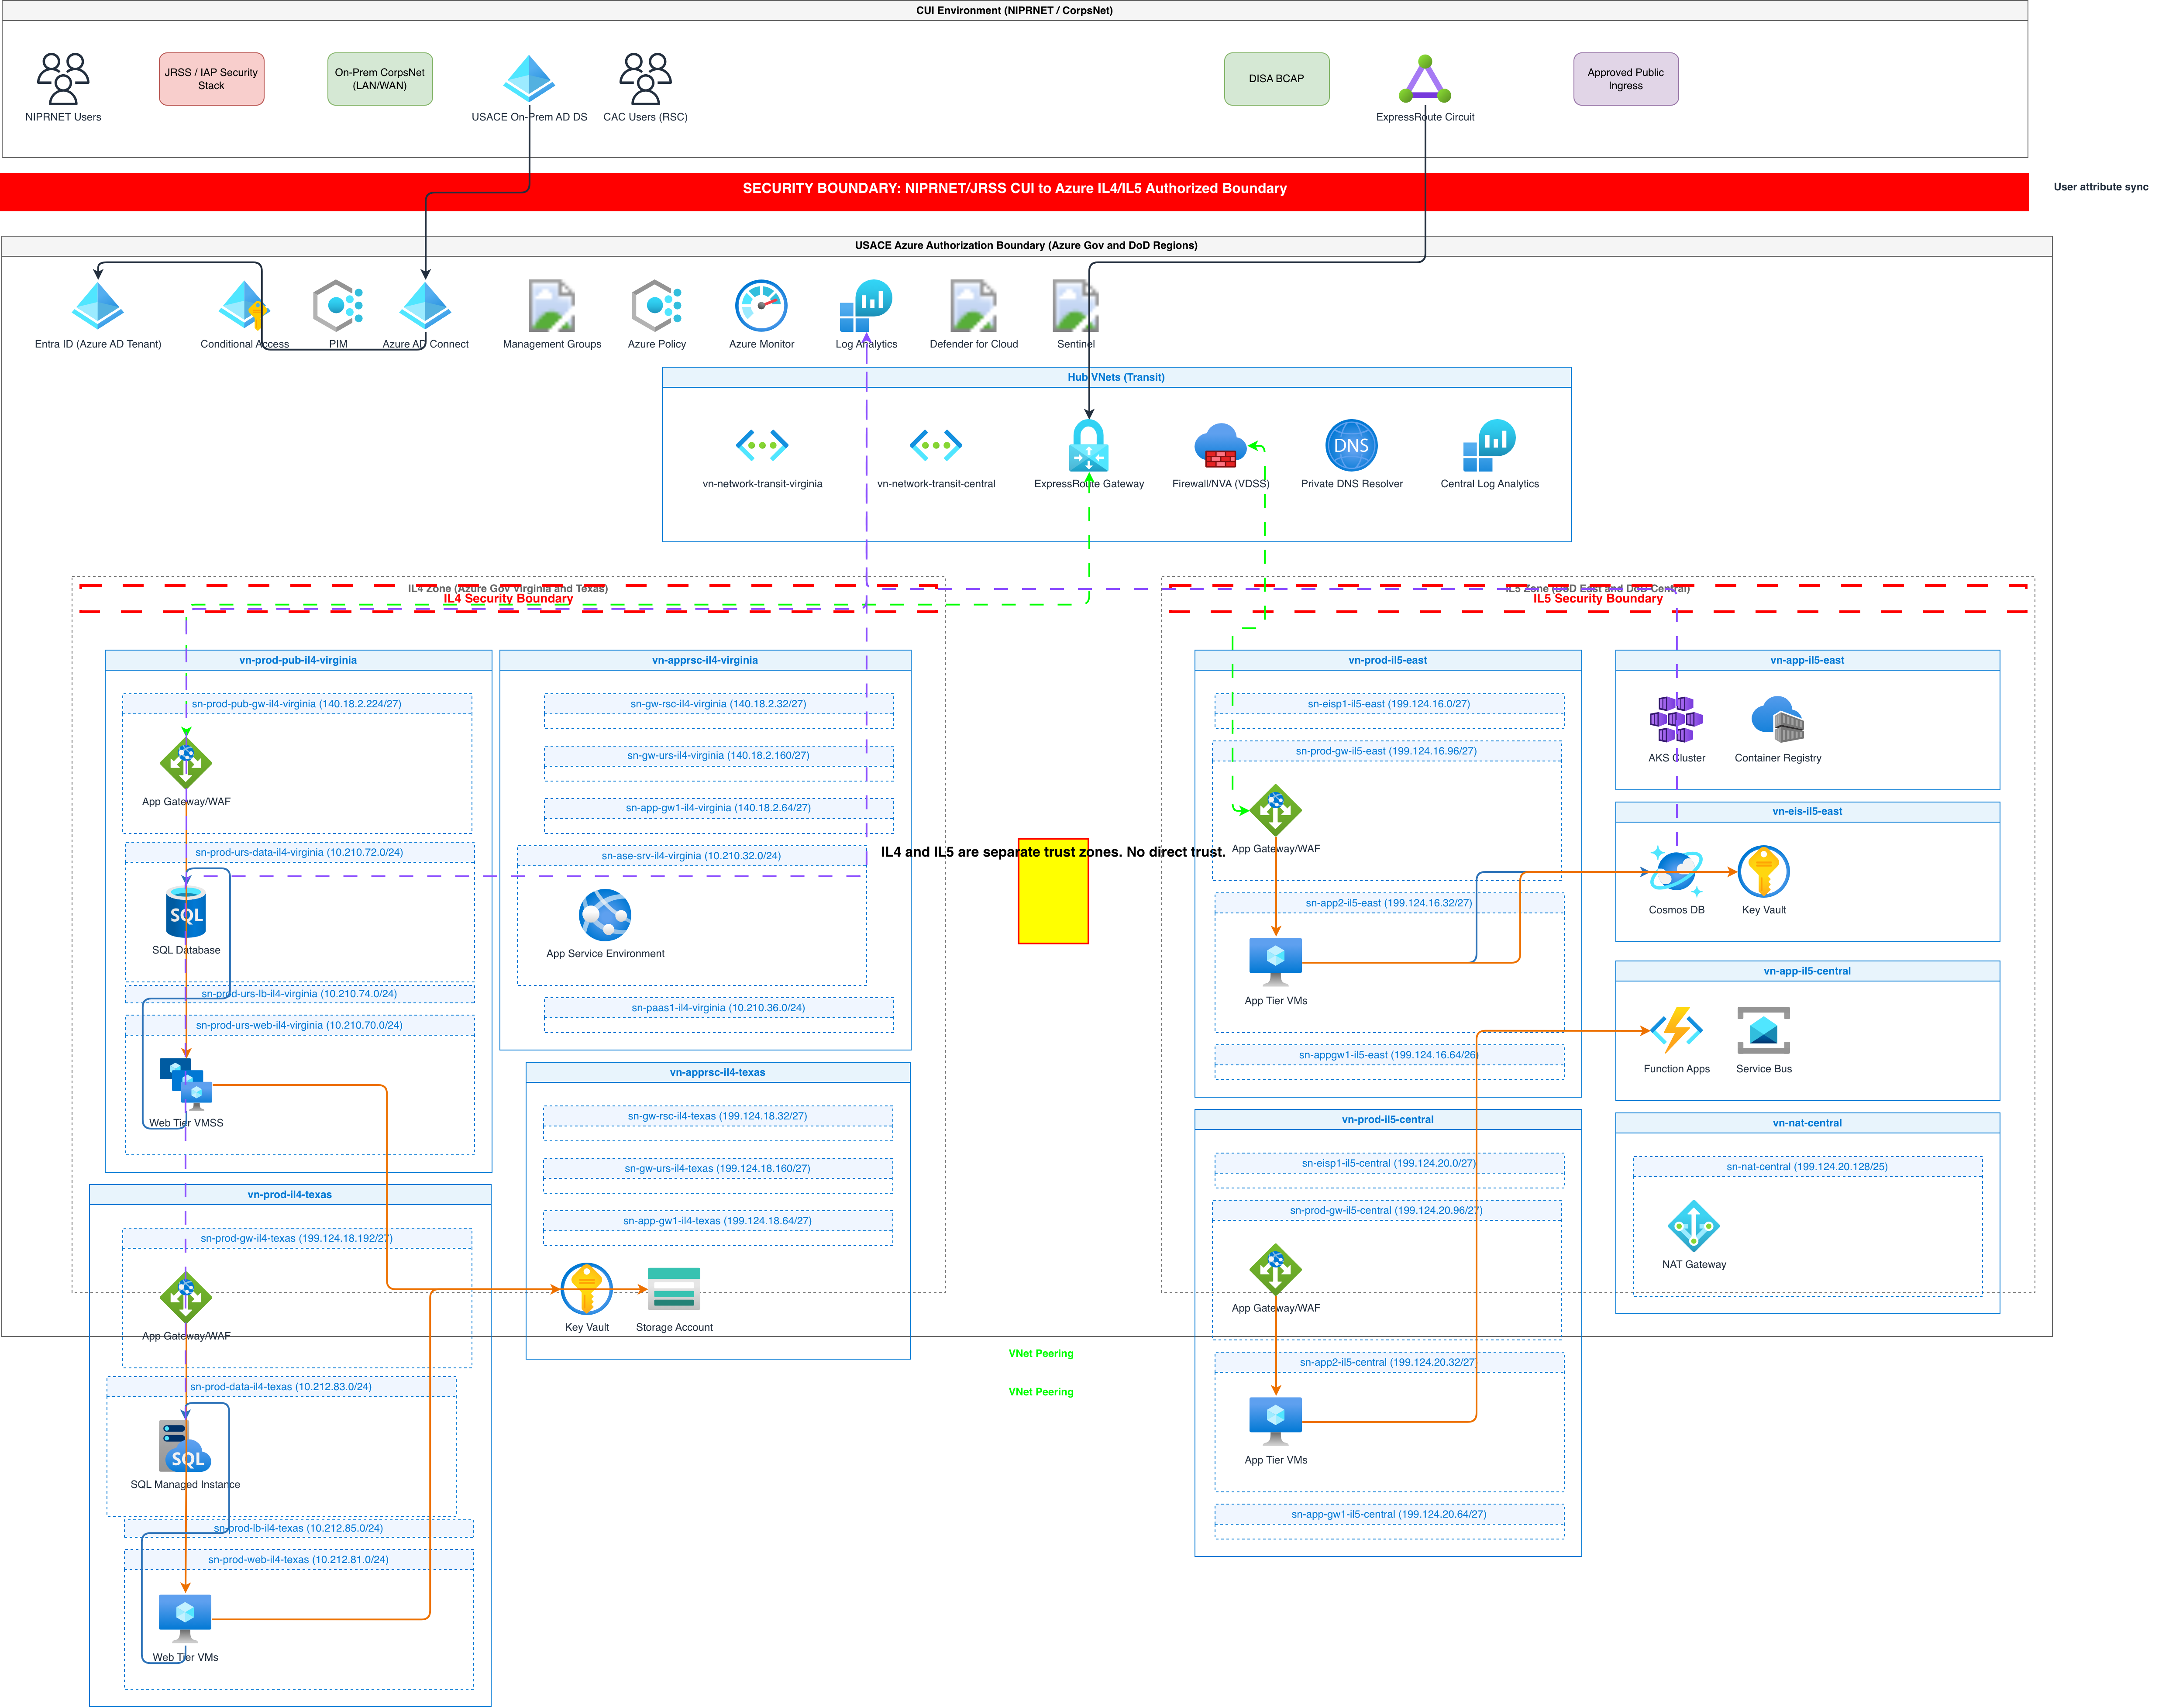
- VPC and subnet boundary boxes with CIDR block annotations and public/private zone labels
- Multi-AZ and multi-region layout with availability zone grouping and cross-region connectors
- Security group and firewall rule annotations showing allowed ingress/egress on connectors
- Architecture warnings: single-AZ (WARN-01), no WAF (WARN-02), no replica (WARN-03), no boundary (WARN-04)
- Service-to-service connectors with protocol labels (HTTPS, gRPC, TCP, AMQP) and port numbers
- Automatic grouping of related services into labeled containers per RULE-06
- VLM visual validation detecting overlapping icons and unreadable labels post-render
How to generate with AI
- 1
Describe your architecture
Write the system design in plain English up to 5,000 characters. Name every service specifically: 'Aurora PostgreSQL Multi-AZ with a read replica' not 'a database.' Describe network topology: 'inside a VPC with public and private subnets across two AZs.' Specify connections: 'ALB forwards HTTPS traffic to ECS Fargate tasks on port 8080.' The more specific your description, the more accurate the icons, boundaries, and architecture warnings become.
- 2
Select cloud provider and mode
Choose AWS, Azure, GCP, or General to load the matching icon library. For multi-cloud architectures, select General to access all icon sets simultaneously. Enable opinionated mode for strict left-to-right layout (RULE-05) and automatic grouping (RULE-06). The AI uses RULE-02 to map service names to official icons and RULE-03 to prevent adding services you didn't mention.
- 3
Review warnings and export
The AI generates the diagram and runs five architecture checks. Review each warning: WARN-01 might suggest adding a second AZ, WARN-02 might recommend adding AWS WAF in front of the ALB, WARN-03 might note the database lacks a read replica. VLM visual validation flags any overlapping icons or unreadable text. Export as .drawio for team editing in Draw.io, PNG for embedding in Confluence, or SVG for web documentation. Commit the .drawio XML to Git for version-controlled architecture docs.
Example prompt
Kubernetes microservices platform on AWS EKS: Three namespaces. Platform namespace has Istio ingress gateway, cert-manager, and external-dns. Application namespace has four deployments: user-api (3 replicas), order-api (3 replicas), inventory-api (2 replicas), notification-worker (2 replicas). Each deployment has a horizontal pod autoscaler. Data namespace has a PostgreSQL StatefulSet with 3 replicas using EBS gp3 persistent volumes and a Redis cluster with 6 nodes (3 primary, 3 replica). Istio service mesh handles mTLS between all services. External traffic enters through NLB to Istio ingress gateway. Show the EKS cluster boundary, namespace boundaries, and the underlying VPC with public and private subnets across three AZs.
Example diagrams from the gallery


Architecture Diagram Tool: AI-Powered vs Manual Canvas vs IaC-Generated
Three methods for creating architecture diagrams. AI-powered tools generate from natural language. Manual canvas tools use drag-and-drop editors. IaC-generated diagrams extract architecture from Terraform, CloudFormation, or CDK code. Each serves different stages of the design lifecycle.
| Feature | AI-Powered | Manual Canvas | IaC-Generated |
|---|---|---|---|
| Input source | Natural-language text describing the target architecture; voice-to-diagram also supported | Drag shapes from icon palettes, draw connectors by hand, position and align manually | Parses existing Terraform HCL, CloudFormation YAML, or CDK TypeScript to extract resources |
| When in the lifecycle | Design phase; diagram the target state before writing any infrastructure code | Any phase; commonly used for polished final documentation after implementation | Post-implementation; diagrams reflect what's actually deployed, not what's planned |
| Accuracy guarantee | Matches the prompt description; RULE-03 prevents hallucinated components; warnings flag risks | Depends entirely on the author's knowledge; no automated validation of the diagram content | Exact match to deployed infrastructure; but missing context about intent, scaling plans, and future state |
| Architecture validation | Five warnings (WARN-01 to WARN-05) cover AZ redundancy, WAF, replicas, security boundaries, ambiguity | No automated checks; architecture review happens in separate meetings or PR reviews | No diagram-level validation; IaC linters (tflint, cfn-lint) check code, not the visual output |
| Update workflow | Edit the text prompt and regenerate; new diagram in seconds with updated layout | Manually move shapes, redraw connectors, re-align; a single added service can cascade layout changes | Update IaC code, re-run extraction tool; diagram auto-updates but layout may shift unpredictably |
| Best suited for | Design proposals, architecture reviews, RFC diagrams, sprint planning system overviews | Final documentation, compliance artifacts, polished executive presentations | As-built documentation, drift detection visualization, infrastructure inventory diagrams |
When to use this pattern
Use an architecture diagram tool when you need to visualize infrastructure at any level: system context, container, or deployment. Design proposals before writing Terraform, architecture review sessions where the team iterates on service placement, incident post-mortems that need a visual of the affected path, and onboarding docs that show new engineers how the system fits together. The AI approach works best during early design when the architecture changes often and manual redrawing wastes time. For compliance documentation requiring pixel-exact layouts and corporate branding, export the .drawio file and polish in Draw.io. For as-built diagrams that must match deployed infrastructure exactly, IaC-generated tools like Terraform graph or Pluralith produce more accurate representations of the actual state.
Frequently asked questions
Which cloud providers does this architecture diagram tool support?
AWS, Azure, and GCP with official vendor icons from 30+ built-in libraries. This architecture diagram tool maps service names to the correct icon automatically. Write 'Lambda' and get the AWS Lambda icon. Write 'Cloud Functions' and get the GCP icon. Select General mode for multi-cloud or vendor-agnostic diagrams.
How does the tool handle VPC and subnet boundaries?
Mention network topology in your description: 'inside a VPC with public and private subnets across two AZs.' The AI creates labeled boundary boxes using RULE-06 grouping. Services place inside the correct subnet container. CIDR block annotations appear on the VPC and subnet boundaries when you include them in your prompt.
What are the five architecture warnings?
WARN-01 detects single availability zone deployments. WARN-02 flags public endpoints without WAF protection. WARN-03 catches databases without read replicas. WARN-04 identifies missing security boundaries like services outside a VPC. WARN-05 marks ambiguous components where your description wasn't specific enough for icon selection.
Can I diagram Kubernetes clusters?
Yes. Describe namespaces, deployments, services, and ingress controllers in your prompt. The AI creates namespace boundary boxes, places pods inside deployment containers, draws service-to-deployment connectors, and applies official Kubernetes icons. StatefulSets, DaemonSets, ConfigMaps, Secrets, and HorizontalPodAutoscalers are all supported with correct K8s iconography.
How do I version-control architecture diagrams?
The .drawio output is XML-based mxGraphModel text. Commit it to Git alongside your code. The XML produces readable diffs when architecture changes. Store the original text prompt in a comment or adjacent file so anyone can regenerate the diagram from the description. This pairs well with architecture decision records.
Related diagram generators
Generate System Architecture Diagrams from Text
Describe your system's components in plain English. Get a valid Draw.io diagram with services, databases, message queues, caches, and API connections.
Generate Cloud Architecture Diagrams from Text
Describe your cloud infrastructure in plain English. Get a valid Draw.io diagram with region boundaries, availability zones, managed services, and DR paths.
Generate AWS architecture diagrams from text
Describe your AWS infrastructure in plain English. Get a valid Draw.io diagram with official AWS icons, VPC boundaries, and Multi-AZ placement.
Make Any Diagram from Text with AI
Describe your system, process, or data flow in plain English. Get a valid Draw.io diagram with correct symbols, aligned nodes, and exportable .drawio XML.