Make Any Diagram from Text with AI
Describe your system, process, or data flow in plain English. Get a valid Draw.io diagram with correct symbols, aligned nodes, and exportable .drawio XML.
This AI diagram maker turns plain-text descriptions into production-ready Draw.io diagrams across every major type: flowcharts, sequence diagrams, architecture diagrams, ER diagrams, data flow diagrams, and network topologies. You write what you need in plain English. The AI picks the right notation, selects icons from 30+ libraries covering AWS, Azure, GCP, Kubernetes, and generic UML, then outputs valid mxGraphModel XML. Every shape snaps to a 10px grid per RULE-04. Architecture warnings flag single-AZ deployments (WARN-01), missing WAFs (WARN-02), and ambiguous components (WARN-05) before you export. The result opens in Draw.io, Confluence, or VS Code without conversion. No manual dragging. No alignment headaches. Just text in, diagram out.
What Is an AI Diagram Maker?
An AI diagram maker generates structured visual diagrams from natural-language input. Traditional tools force you to pick shapes, place them on a canvas, draw connectors, align everything, and repeat for every change. That process takes 30 to 90 minutes for a mid-complexity architecture diagram. An AI diagram maker compresses that to seconds. You describe the system. The AI handles notation selection, layout, grouping, and alignment. Diagrams.so covers the full spectrum of diagram types. Write 'three-tier web app on AWS with ALB, ECS Fargate, and Aurora PostgreSQL' and get an architecture diagram with the correct AWS icons. Write 'user login flow with MFA fallback' and get a flowchart with ISO 5807 decision diamonds. Write 'order service calls payment service, payment service calls Stripe API' and get a UML sequence diagram with lifelines and activation bars. The AI enforces left-to-right layout by default (RULE-05). Opinionated mode prevents manual overrides that break readability. VLM visual validation catches overlapping labels and tangled arrows after generation, not just syntax errors. Architecture warnings cover five categories: single-AZ risk (WARN-01), public endpoints missing a WAF (WARN-02), databases without replicas (WARN-03), absent security boundaries (WARN-04), and ambiguous components (WARN-05). The output is native .drawio XML. Export to PNG, SVG, or open directly in Draw.io desktop. Version-control the XML in Git alongside your code.
Key components
- Flowcharts with ISO 5807 terminators, decision diamonds, and parallel gateways
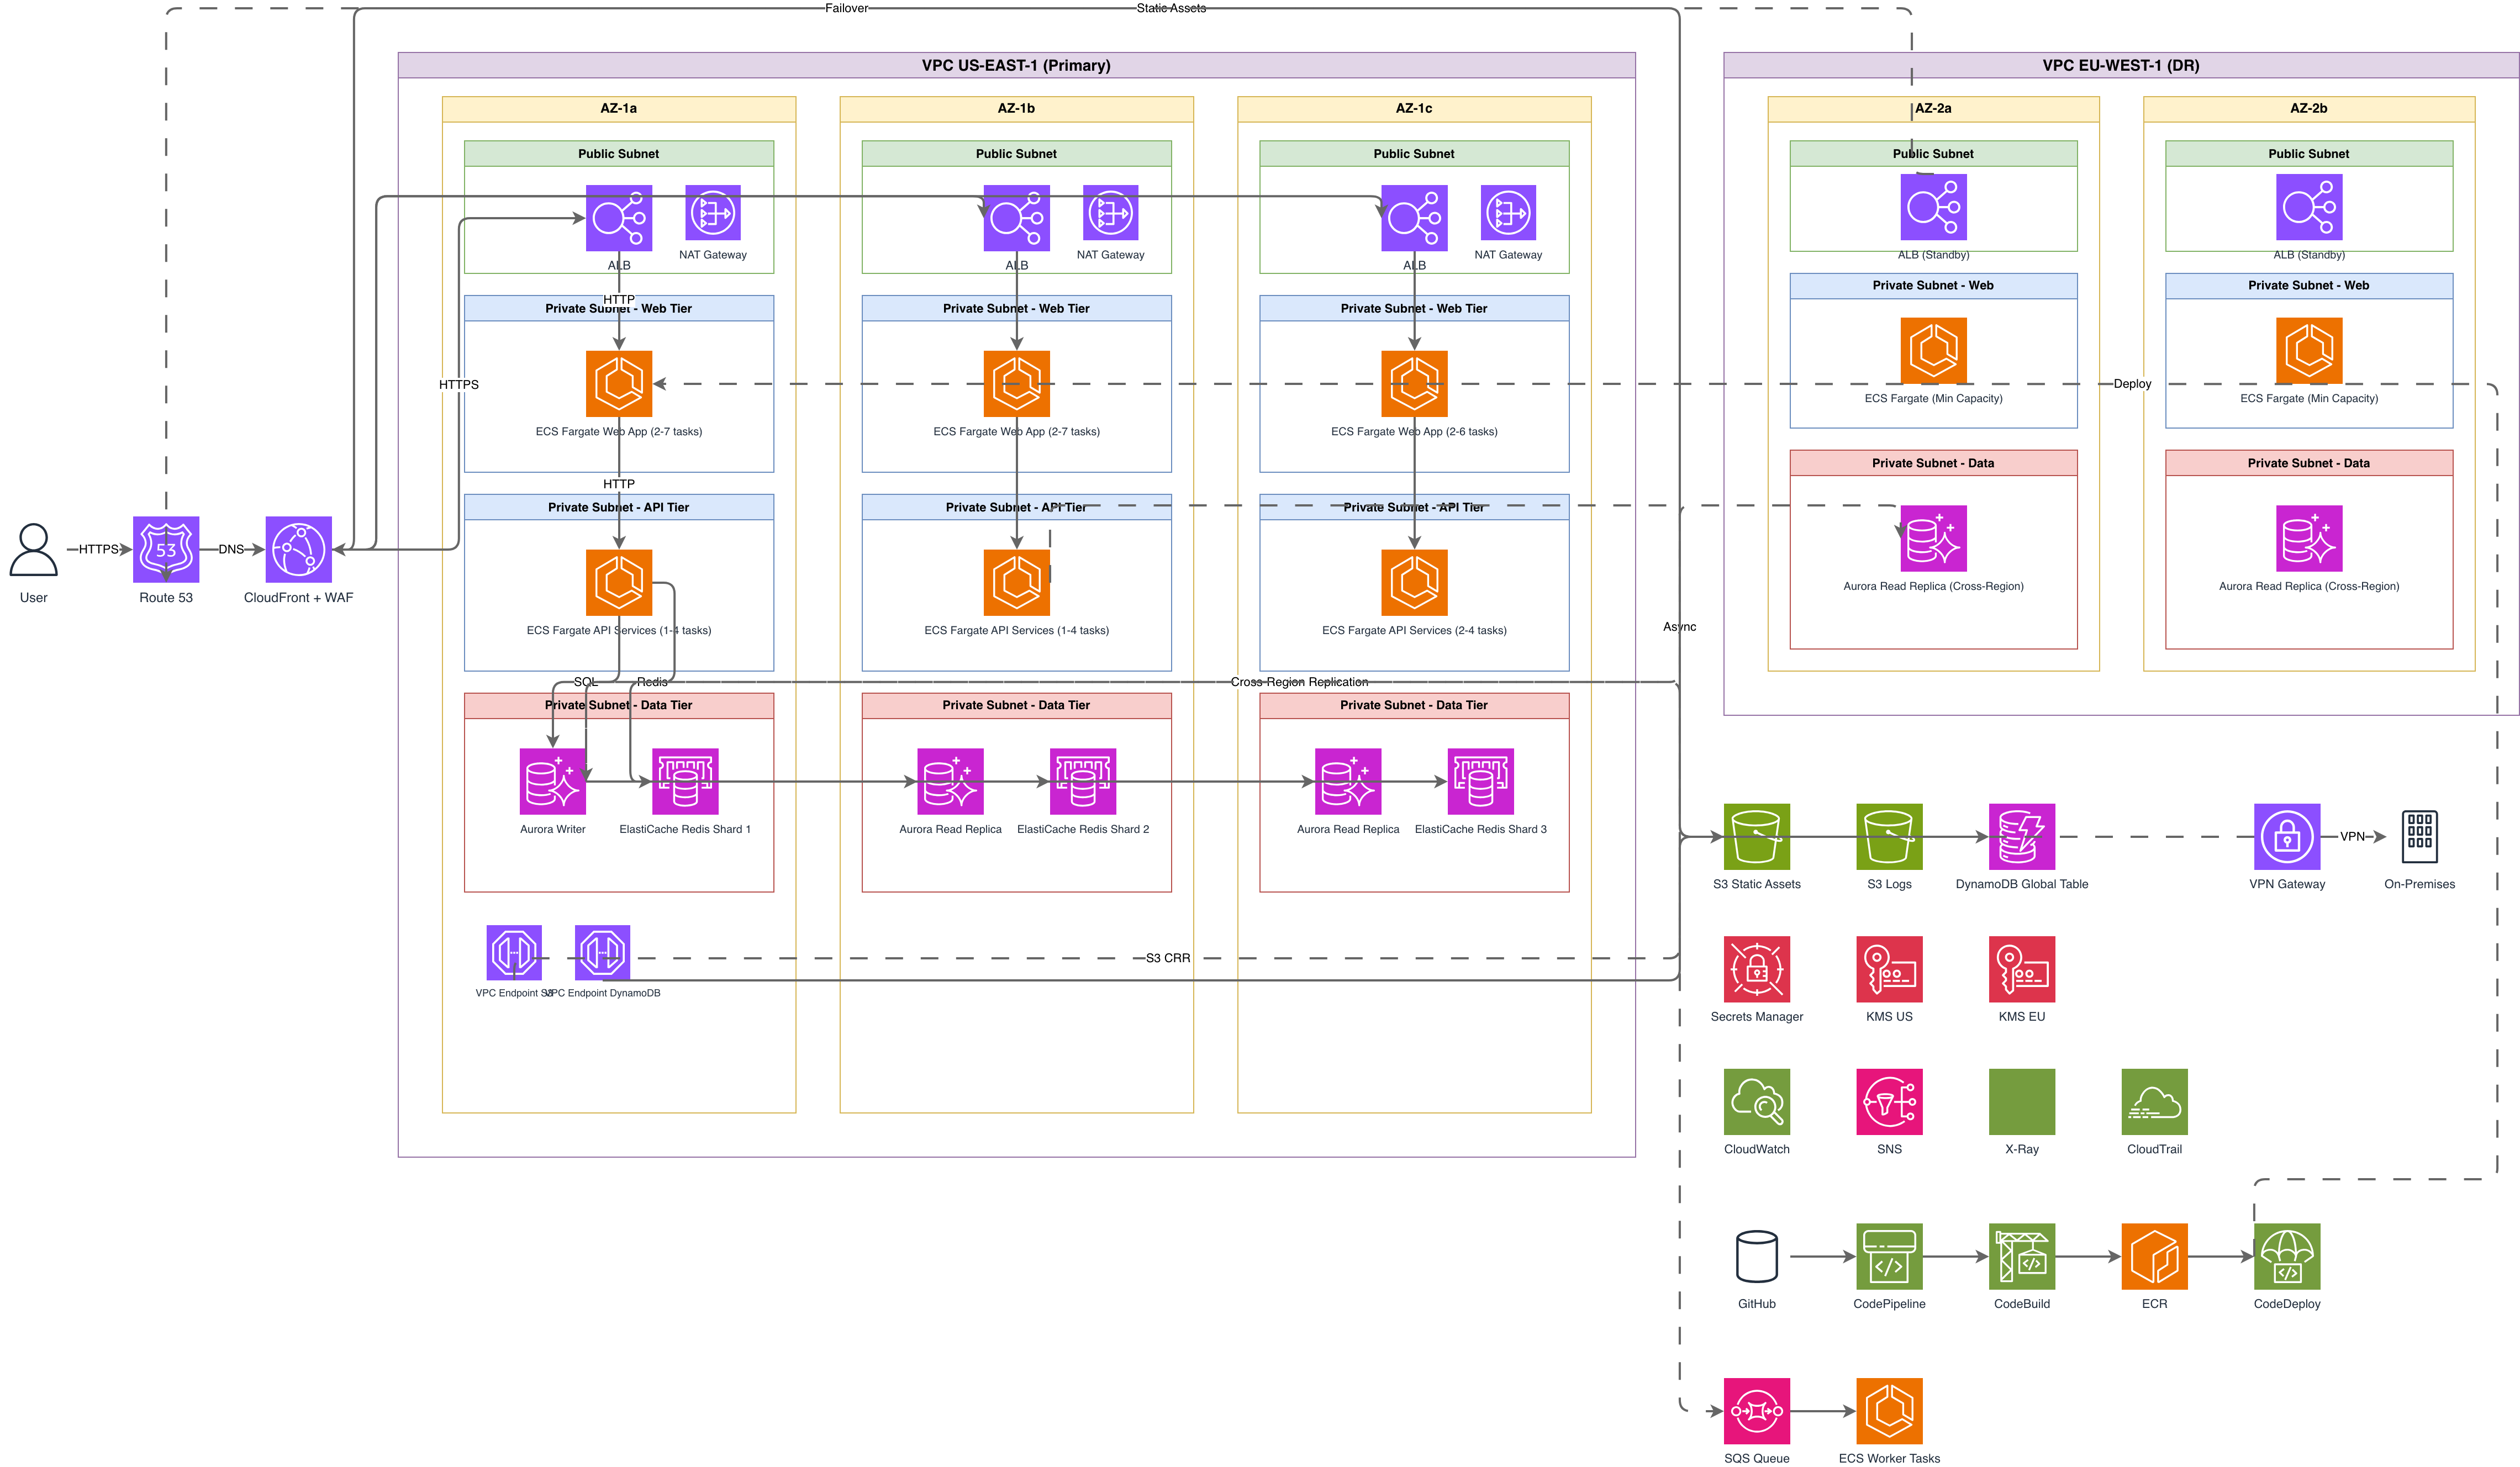
- Architecture diagrams with provider-specific icons from AWS, Azure, and GCP libraries
- Sequence diagrams with UML lifelines, activation bars, and synchronous/async arrows
- ER diagrams with crow's-foot notation showing cardinality and foreign key relationships
- Data flow diagrams using Yourdon-DeMarco or Gane-Sarson notation
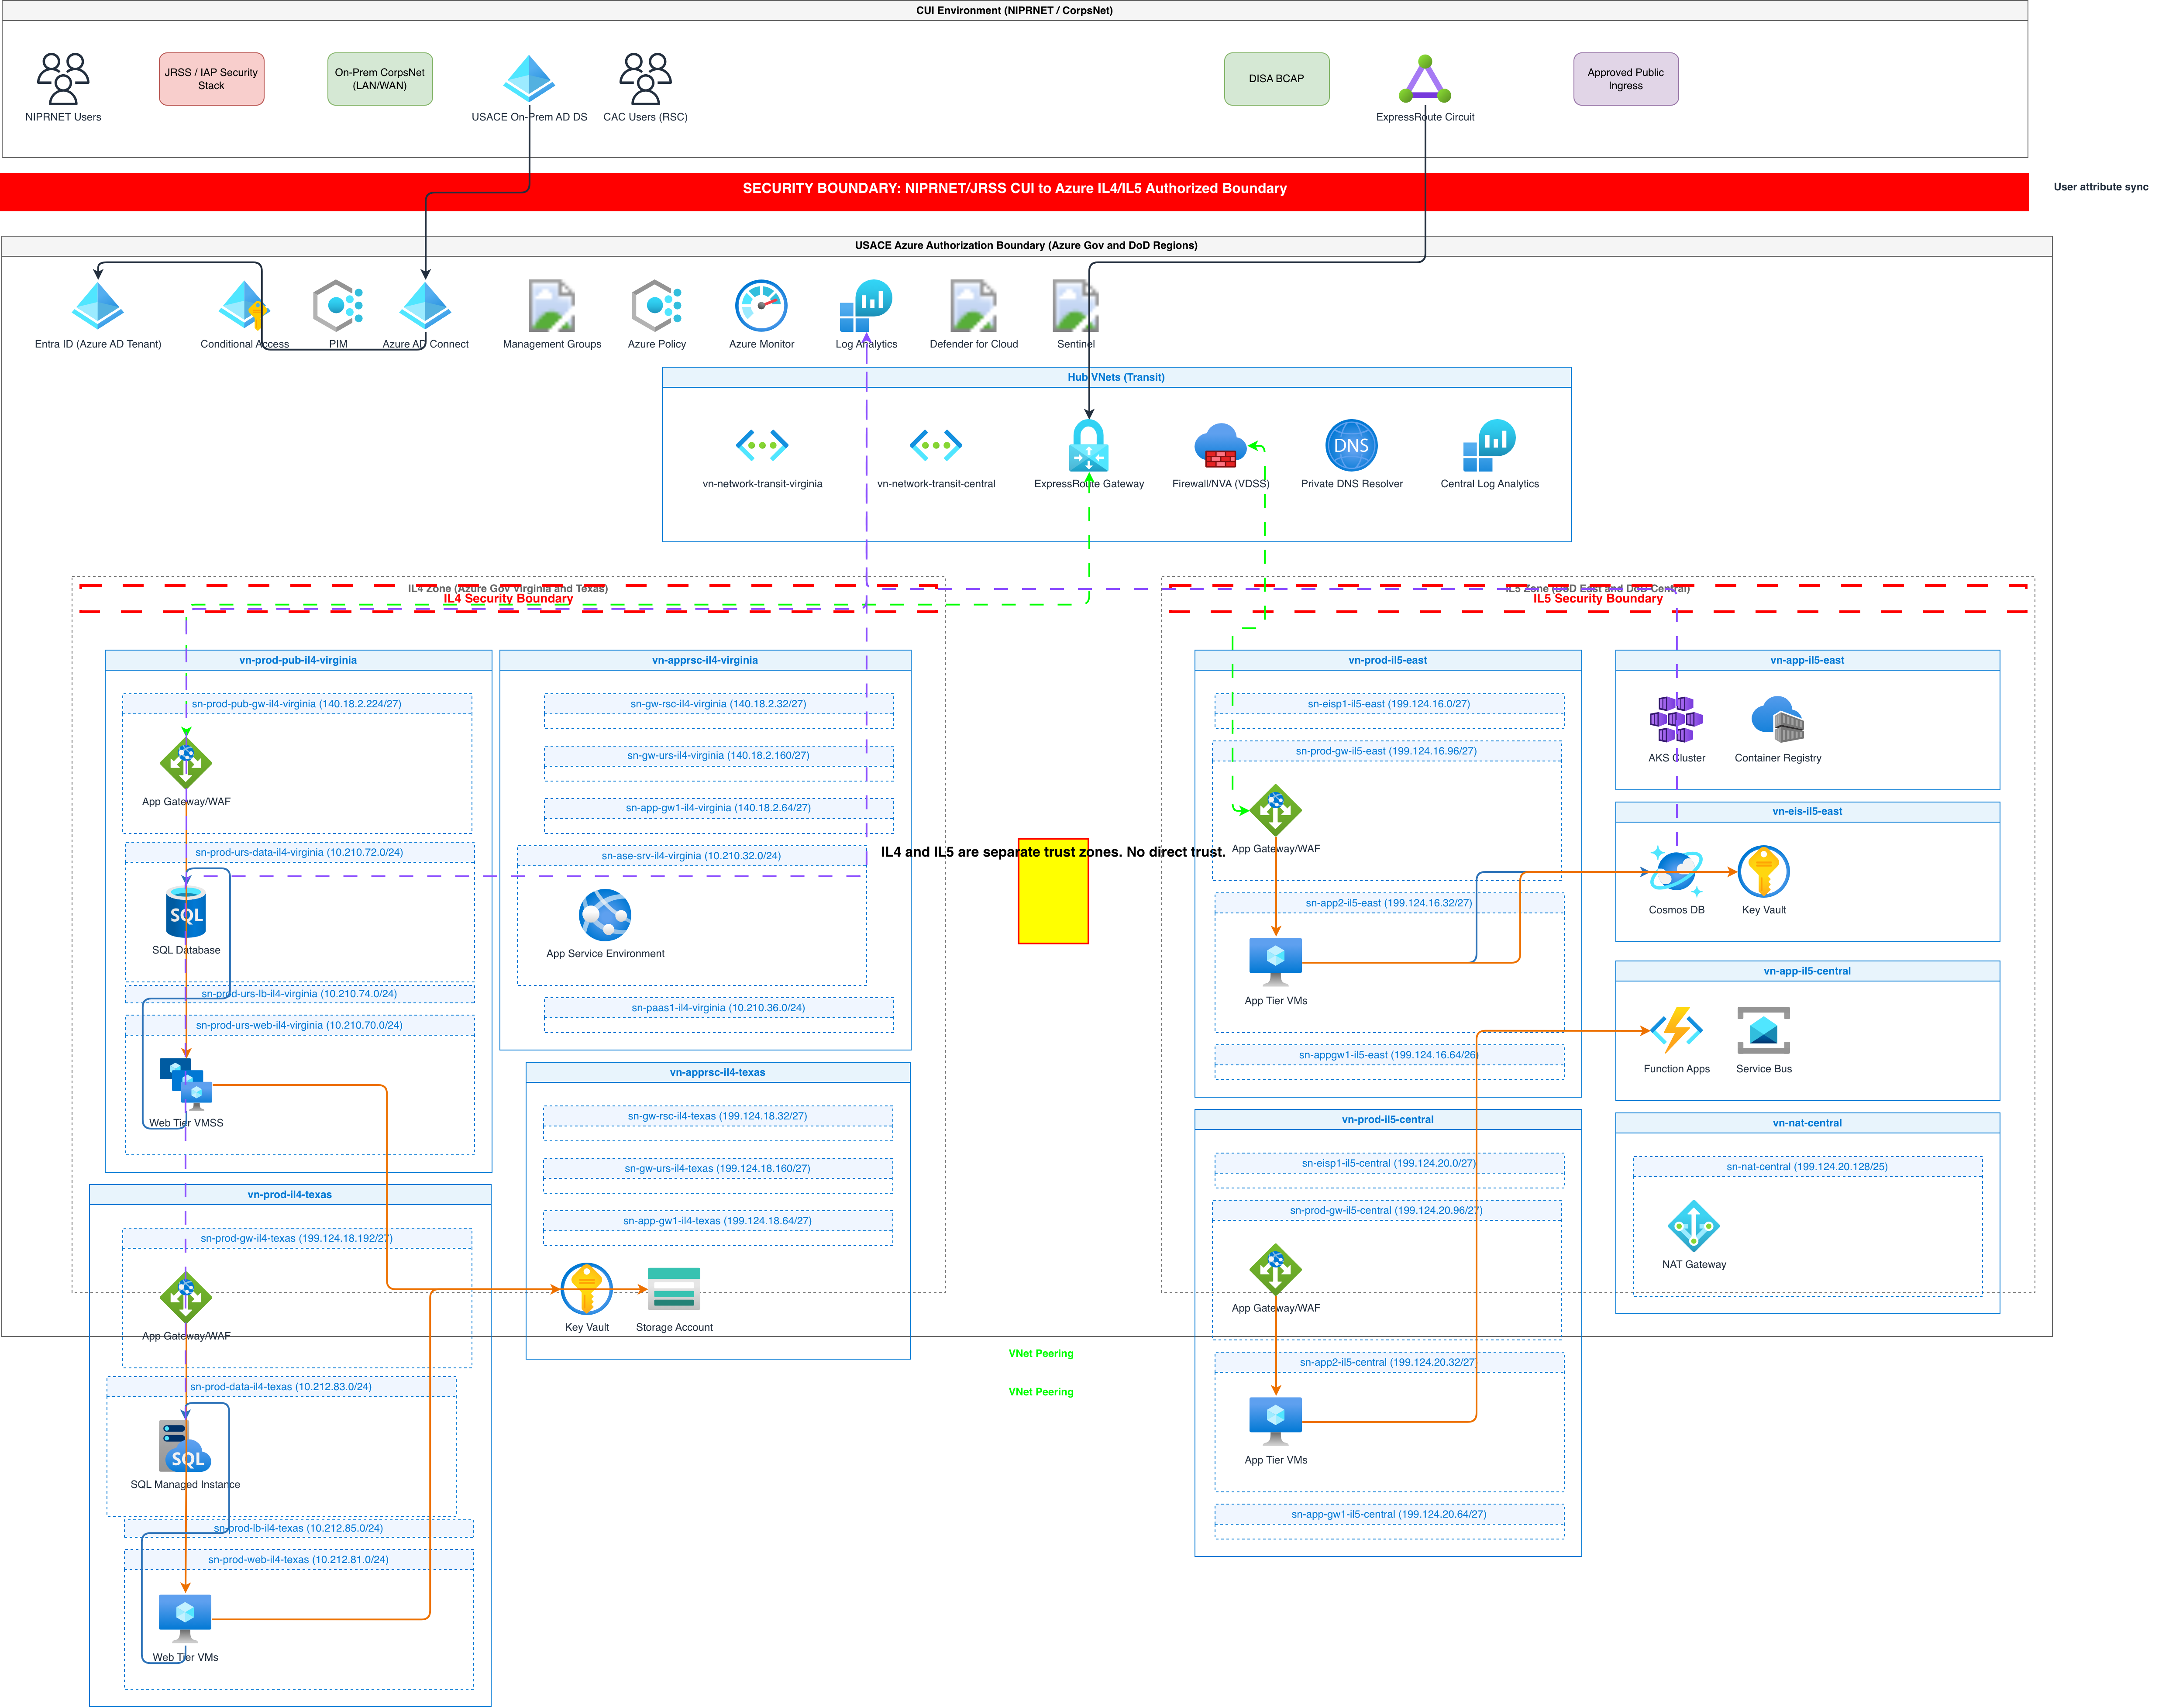
- Network topology diagrams with CIDR blocks, subnets, and security group boundaries
- Automatic grouping of related components into labeled containers per RULE-06
- Architecture warnings (WARN-01 through WARN-05) rendered as color-coded annotations
How to generate with AI
- 1
Describe what you need
Write your diagram requirement in plain English up to 5,000 characters. Be specific about components and relationships. For example: 'Microservices architecture with an API Gateway routing to three services: user-service backed by PostgreSQL, order-service backed by DynamoDB, and notification-service connected to SES and SNS. Add a Redis cache layer between the gateway and user-service.' Mention the cloud provider if you want vendor-specific icons.
- 2
Choose diagram type and provider
Select the diagram type from the dropdown: architecture, flowchart, sequence, ER, data flow, or network. Pick a cloud provider (AWS, Azure, GCP, or General) to load the matching icon library from the 30+ sets available. Enable opinionated mode to enforce strict layout rules automatically. The AI uses RULE-05 for left-to-right flow and RULE-06 to group related components.
- 3
Generate, validate, and export
Click generate. The AI outputs a grid-aligned mxGraphModel XML file. VLM visual validation scans for overlapping elements and crossing connectors. Architecture warnings highlight risks: a database without a replica triggers WARN-03, a public-facing endpoint without a WAF triggers WARN-02. Download as .drawio for further editing, or export to PNG or SVG. The file works in Draw.io desktop, the VS Code extension, and Confluence.
Example prompt
Event-driven e-commerce platform: React frontend behind CloudFront CDN. API Gateway routes requests to four Lambda functions: catalog-service reads from DynamoDB, cart-service uses ElastiCache Redis, order-service writes to Aurora PostgreSQL, and payment-service calls Stripe API. Order-service publishes OrderPlaced events to EventBridge. EventBridge triggers three subscribers: inventory-service (decrements stock in DynamoDB), notification-service (sends confirmation via SES), and analytics-service (writes to Kinesis Firehose into S3 for Athena queries). Add a dead-letter queue on each Lambda. Show VPC boundaries around the backend services.
Example diagrams from the gallery


AI Diagram Maker vs Manual Diagramming vs Diagram-as-Code
Three approaches to creating technical diagrams, each with different tradeoffs in speed, flexibility, and version control. AI diagram makers generate from natural language. Manual tools use drag-and-drop canvases. Diagram-as-code tools use domain-specific languages like Mermaid or D2.
| Feature | AI Diagram Maker | Manual Diagramming | Diagram-as-Code |
|---|---|---|---|
| Input method | Plain English text or voice-to-diagram; no syntax to learn | Drag shapes from palettes, draw connectors by hand, align manually | Write DSL code in Mermaid, PlantUML, or D2 with strict syntax rules |
| Time to first diagram | Under 30 seconds from prompt to rendered .drawio file | 15 to 60 minutes depending on complexity and familiarity with the tool | 5 to 20 minutes; faster than manual but requires knowing the DSL syntax |
| Version control | Native .drawio XML diffs cleanly in Git; regenerate from updated prompts | Binary files (.vsdx, .png) don't diff; some tools offer XML but it's verbose | Source files are plain text and diff well; output images need regeneration |
| Icon library support | 30+ built-in libraries covering AWS, Azure, GCP, Kubernetes, and UML | Depends on tool; Visio has stencils, Lucidchart has shape libraries, varies widely | Limited; Mermaid has no cloud icons, PlantUML has stdlib, D2 supports custom SVGs |
| Validation and warnings | VLM visual validation plus architecture warnings WARN-01 through WARN-05 | No automated validation; errors caught only during human review | Syntax validation only; no visual overlap detection or architecture review |
| Best suited for | Rapid prototyping, architecture reviews, documentation sprints, stakeholder presentations | Highly custom layouts, pixel-precise marketing diagrams, one-off illustrations | CI/CD-generated docs, reproducible diagrams, teams already using Mermaid or PlantUML |
When to use this pattern
Use an AI diagram maker when you need a diagram fast and don't want to fight with a canvas. Architecture reviews, sprint documentation, incident post-mortems, and stakeholder presentations are prime candidates. If you're describing a system that already exists in your head, typing it out is faster than dragging shapes. For highly custom visual layouts where pixel placement matters (marketing collateral, infographics), manual tools still win. If your team already has a Mermaid or PlantUML pipeline in CI/CD, diagram-as-code may fit better for automated doc generation. The AI diagram maker shines when you need correct notation, vendor-specific icons, and architecture validation without memorizing DSL syntax or hunting through shape palettes.
Frequently asked questions
What types of diagrams can this AI diagram maker create?
This AI diagram maker handles flowcharts, architecture diagrams, sequence diagrams, ER diagrams, data flow diagrams, network topologies, and UML class diagrams. It selects the correct notation for each type automatically. The output is always native .drawio XML that opens in Draw.io or any mxGraph-compatible editor.
Do I need to know any diagramming syntax?
No. You write plain English. The AI parses your description and maps it to the correct symbols and notation. ISO 5807 for flowcharts, UML 2.5 for sequence diagrams, crow's-foot for ER diagrams. Voice-to-diagram is also available if you prefer speaking your description instead of typing it.
How does the AI choose which icons to use?
It reads the cloud provider you select (AWS, Azure, GCP, or General) and loads the matching icon library from 30+ available sets. Mention specific services like 'RDS PostgreSQL' or 'Azure Functions' in your prompt, and the AI places the official vendor icon. Generic components get standard UML shapes.
What are architecture warnings?
Five non-blocking alerts that flag common design risks. WARN-01 detects single-AZ deployments. WARN-02 flags public endpoints without a WAF. WARN-03 catches databases missing replicas. WARN-04 identifies absent security boundaries. WARN-05 highlights ambiguous components. They appear alongside your diagram without blocking generation.
Can I edit the generated diagram after export?
Yes. The .drawio XML file is fully editable in Draw.io desktop, the draw.io VS Code extension, or Confluence. Move shapes, add nodes, change labels, or adjust connectors. The 10px grid alignment from generation is preserved. You can also update your prompt and regenerate to iterate faster than manual editing.
Related diagram generators
Generate Diagrams with AI, Not Drag-and-Drop
Write what your system does. The AI picks the notation, selects vendor icons, enforces grid alignment, and outputs valid mxGraphModel XML you can open in Draw.io.
Generate Flowcharts from Text with AI
Describe a process in plain English. Get a valid Draw.io flowchart with correct ISO 5807 symbols, decision diamonds, and directional arrows.
Generate AWS architecture diagrams from text
Describe your AWS infrastructure in plain English. Get a valid Draw.io diagram with official AWS icons, VPC boundaries, and Multi-AZ placement.
Generate System Architecture Diagrams from Text
Describe your system's components in plain English. Get a valid Draw.io diagram with services, databases, message queues, caches, and API connections.