Diagram as Code: Comparing the Major Tools
A technical comparison of Mermaid, PlantUML, D2, and Graphviz for creating diagrams from code, including syntax examples, rendering capabilities, and when AI generation outperforms all of them.
What diagram as code means and why engineers adopted it
Diagram as code is the practice of defining diagrams using a text-based syntax that a renderer converts into a visual output. Instead of dragging shapes onto a canvas, you write a description in a domain-specific language and a tool produces the diagram. This diagram as code comparison covers the four tools that matter: Mermaid, PlantUML, D2, and Graphviz. The approach gained traction because it solves three problems that drag-and-drop tools create. First, version control. A text-based diagram definition diffs cleanly in Git. You can review a diagram change in a pull request the same way you review a code change. Second, reproducibility. The same input always produces the same output. No manual positioning means no style drift across team members. Third, documentation proximity. Diagram code lives in Markdown files, code comments, or dedicated .mmd/.puml files alongside the source code it describes. Engineers adopted diagram-as-code for the same reason they adopted infrastructure-as-code: declarative text files stored in version control are easier to manage than manually configured artifacts. Terraform replaced clicking through the AWS console. Mermaid replaced clicking through Draw.io. The analogy is imperfect because Mermaid and PlantUML have significant limitations in layout control, styling, and diagram type support that drag-and-drop tools don't share. But for simple diagrams embedded in documentation, diagram-as-code tools are fast and maintainable. The primary trade-off is layout control. Diagram-as-code tools use automatic layout algorithms. You can influence the layout through hints (direction, ranking, grouping), but you can't place a specific shape at pixel coordinates. For architecture diagrams where visual grouping and spatial relationships carry meaning, this is a real limitation.
Mermaid: GitHub-native, simple syntax, limited styling
Mermaid is a JavaScript-based diagram renderer that converts a simple text syntax into SVG output. Its defining feature is native GitHub rendering: wrap Mermaid code in a ```mermaid code fence in any Markdown file, README, issue, or pull request, and GitHub renders it as a diagram. GitLab, Notion, Docusaurus, and many documentation platforms also render Mermaid natively. A basic Mermaid flowchart: 'graph LR; A[User] -->|HTTP| B[API Gateway]; B --> C[Auth Service]; B --> D[Order Service]; C --> E[(PostgreSQL)]; D --> E;'. The syntax is concise. Nodes are defined inline with their labels. Edges use arrow syntax with optional labels. Direction is set with graph LR (left-to-right) or graph TD (top-down). Mermaid supports flowcharts, sequence diagrams, class diagrams, state diagrams, ER diagrams, Gantt charts, pie charts, and journey maps. Sequence diagrams are particularly well-supported with proper lifeline rendering, activation bars, and alt/loop fragments. The limitations become apparent with complex diagrams. Mermaid provides minimal control over node positioning. You can't place a node at specific coordinates. The automatic layout engine (dagre) handles positioning, and its decisions aren't always optimal for architecture diagrams with many cross-cutting connections. Styling is limited to predefined themes and CSS class assignments. You can change colors and fonts but can't control border widths, shadow effects, or complex shape styles. Mermaid doesn't support cloud provider icon sets. An AWS Lambda function renders as a generic rectangle with a text label, not the recognizable Lambda icon. For documentation-embedded diagrams where simplicity and portability matter more than visual fidelity, Mermaid is the strongest choice. For architecture diagrams presented to stakeholders, it falls short.
PlantUML: Java-based, UML-focused, powerful but heavyweight
PlantUML is a Java application that renders diagrams from a text-based syntax. It excels at UML diagrams: class diagrams, sequence diagrams, activity diagrams, component diagrams, and state machines. Its syntax for sequence diagrams is more expressive than Mermaid's, supporting features like message numbering (autonumber), dividers, reference frames, and detailed activation bar control. A PlantUML sequence diagram: '@startuml; actor User; User -> Gateway : POST /login; Gateway -> AuthService : validateCredentials; AuthService -> Database : SELECT user; Database --> AuthService : user record; alt valid credentials; AuthService --> Gateway : JWT token; else invalid; AuthService --> Gateway : 401 Unauthorized; end; @enduml'. PlantUML renders through a Java process or a server. The official PlantUML Server runs as a Docker container or web service. Most teams deploy a PlantUML server internally and configure their documentation toolchain to call it during build time. The VS Code extension, IntelliJ plugin, and Confluence plugin all connect to a PlantUML server for rendering. This Java dependency is PlantUML's primary drawback. Unlike Mermaid, which runs in the browser with zero server infrastructure, PlantUML requires a JVM. In CI/CD pipelines, this means pulling a Java Docker image for diagram rendering. For local development, it means installing Java or running a Docker container. PlantUML supports sprites and icon libraries, including AWS, Azure, GCP, and Kubernetes icons through community-maintained stdlib imports. The syntax is verbose: '!include <awslib/Compute/Lambda>' followed by 'Lambda(myFunction, "Process Order", "Node.js 18")'. The resulting diagrams look better than Mermaid's for architecture work because they include recognizable cloud icons. But maintaining these diagrams requires learning PlantUML's stdlib syntax, which has a steep curve.
D2: modern syntax, Go-based, TALA layout engine
D2 (Declarative Diagramming) is the newest entrant in the diagram-as-code space. Built in Go and released in 2022 by Terrastruct, it addresses specific frustrations with Mermaid and PlantUML. The syntax is cleaner than both predecessors. A basic D2 diagram: 'user -> api: HTTP; api -> auth: validate; api -> orders: create; auth -> db: query; orders -> db: insert;'. Declarations are one per line. Labels follow colons. Connections use arrows. Nesting uses curly braces for containers: 'vpc { api; auth; db; }' creates a group labeled 'vpc' containing three nodes. D2's headline feature is the TALA layout engine, a proprietary auto-layout algorithm that produces significantly better results than dagre (used by Mermaid) or GraphViz (used by PlantUML) for architecture diagrams. TALA handles overlapping edge labels, container nesting, and complex connection routing more gracefully. The open-source version of D2 includes dagre and ELK layout engines. TALA requires a commercial license. D2 supports multiple output formats: SVG, PNG, and animated SVGs with frame-by-frame transitions. The animation feature is unique and useful for presentations where you want to reveal an architecture incrementally. The theming system is more capable than Mermaid's: built-in themes cover terminal-dark, vintage, and several professional styles. Custom themes override specific color variables. D2's limitations are ecosystem maturity and platform support. Mermaid renders natively on GitHub, GitLab, and Notion. D2 renders natively on none of them. You need a build step to convert D2 files to SVG or PNG for inclusion in documentation. The community is smaller, which means fewer examples, fewer Stack Overflow answers, and fewer editor integrations. For teams that control their documentation build pipeline and want the best auto-layout quality, D2 is the strongest diagram-as-code option today.
Graphviz: the academic standard with DOT language
Graphviz is the oldest diagram-as-code tool, developed at AT&T Labs in the early 1990s. Its DOT language is a well-documented graph description format that has influenced every subsequent tool in this space. Mermaid, PlantUML, and D2 all owe conceptual debt to Graphviz's approach of declarative graph definition with automatic layout. DOT syntax defines graphs with nodes and edges: 'digraph G { rankdir=LR; user [shape=box]; api [shape=box]; db [shape=cylinder]; user -> api [label="HTTP"]; api -> db [label="SQL"]; }'. Node shapes are explicitly declared. Edge labels are attributes. The rankdir directive controls layout direction. Graphviz includes multiple layout engines: dot (hierarchical, best for DAGs), neato (spring model, for undirected graphs), fdp (force-directed placement), circo (circular layout), and twopi (radial layout). The dot engine is what most people mean when they say 'Graphviz.' It excels at dependency graphs, call graphs, and hierarchical structures where nodes have a natural ordering. Graphviz's strengths are in academic and automated contexts. Compiler visualization tools generate DOT output for abstract syntax trees and control flow graphs. Terraform graph produces DOT output showing resource dependencies. Doxygen generates class hierarchy diagrams using Graphviz. These automated use cases play to Graphviz's strengths: processing structured data into visual output. For manually authored diagrams, Graphviz shows its age. The styling options are limited compared to modern tools. Colors, fonts, and shapes are configurable, but the visual output looks functional rather than polished. There's no support for cloud provider icons, no container nesting with visual boundaries, and no thematic styling. Edge routing with the dot engine frequently produces unnecessary crossings for complex graphs. If you're generating diagrams programmatically from data structures, Graphviz remains a solid choice. If you're authoring diagrams manually for documentation, Mermaid or D2 are better options.
AI generation vs code-based: when each approach wins
Diagram-as-code tools and AI diagram generation serve different purposes and work best in different contexts. Understanding when to use each prevents you from fighting a tool that doesn't fit your use case. Diagram-as-code wins for living documentation that changes with the codebase. A Mermaid diagram in a README that shows the project's service architecture should be maintained as code. When a developer adds a new service, they update the Mermaid definition in the same pull request. The diagram stays in sync because it lives alongside the code. CI/CD can validate that the Mermaid syntax is valid, and GitHub renders it automatically. This workflow doesn't benefit from AI generation because the diagram needs to be manually maintained anyway. Diagram-as-code also wins for programmatically generated diagrams. If you're visualizing a database schema, a dependency graph, or a network topology from structured data, generating DOT or Mermaid syntax from that data is straightforward and deterministic. AI generation wins for one-off architecture diagrams created during design reviews, onboarding documentation, and technical proposals. These diagrams need to look professional, use correct cloud provider icons, and follow consistent layout conventions. Building this manually in a drag-and-drop tool takes 30 minutes. Writing it in PlantUML with AWS icons takes 20 minutes and requires familiarity with the stdlib syntax. Describing it in natural language and getting a .drawio file takes 2 minutes. AI generation also wins when you need format portability. Diagrams.so outputs native .drawio files that open in Draw.io, VS Code, Confluence, and any mxGraph-compatible editor. The output is a fully editable diagram, not a rasterized image. You can refine the AI-generated layout, add components, and adjust styling in the same tool your team already uses. Diagram-as-code tools produce SVG or PNG output that you can view but not meaningfully edit without the original source.
Real-world examples
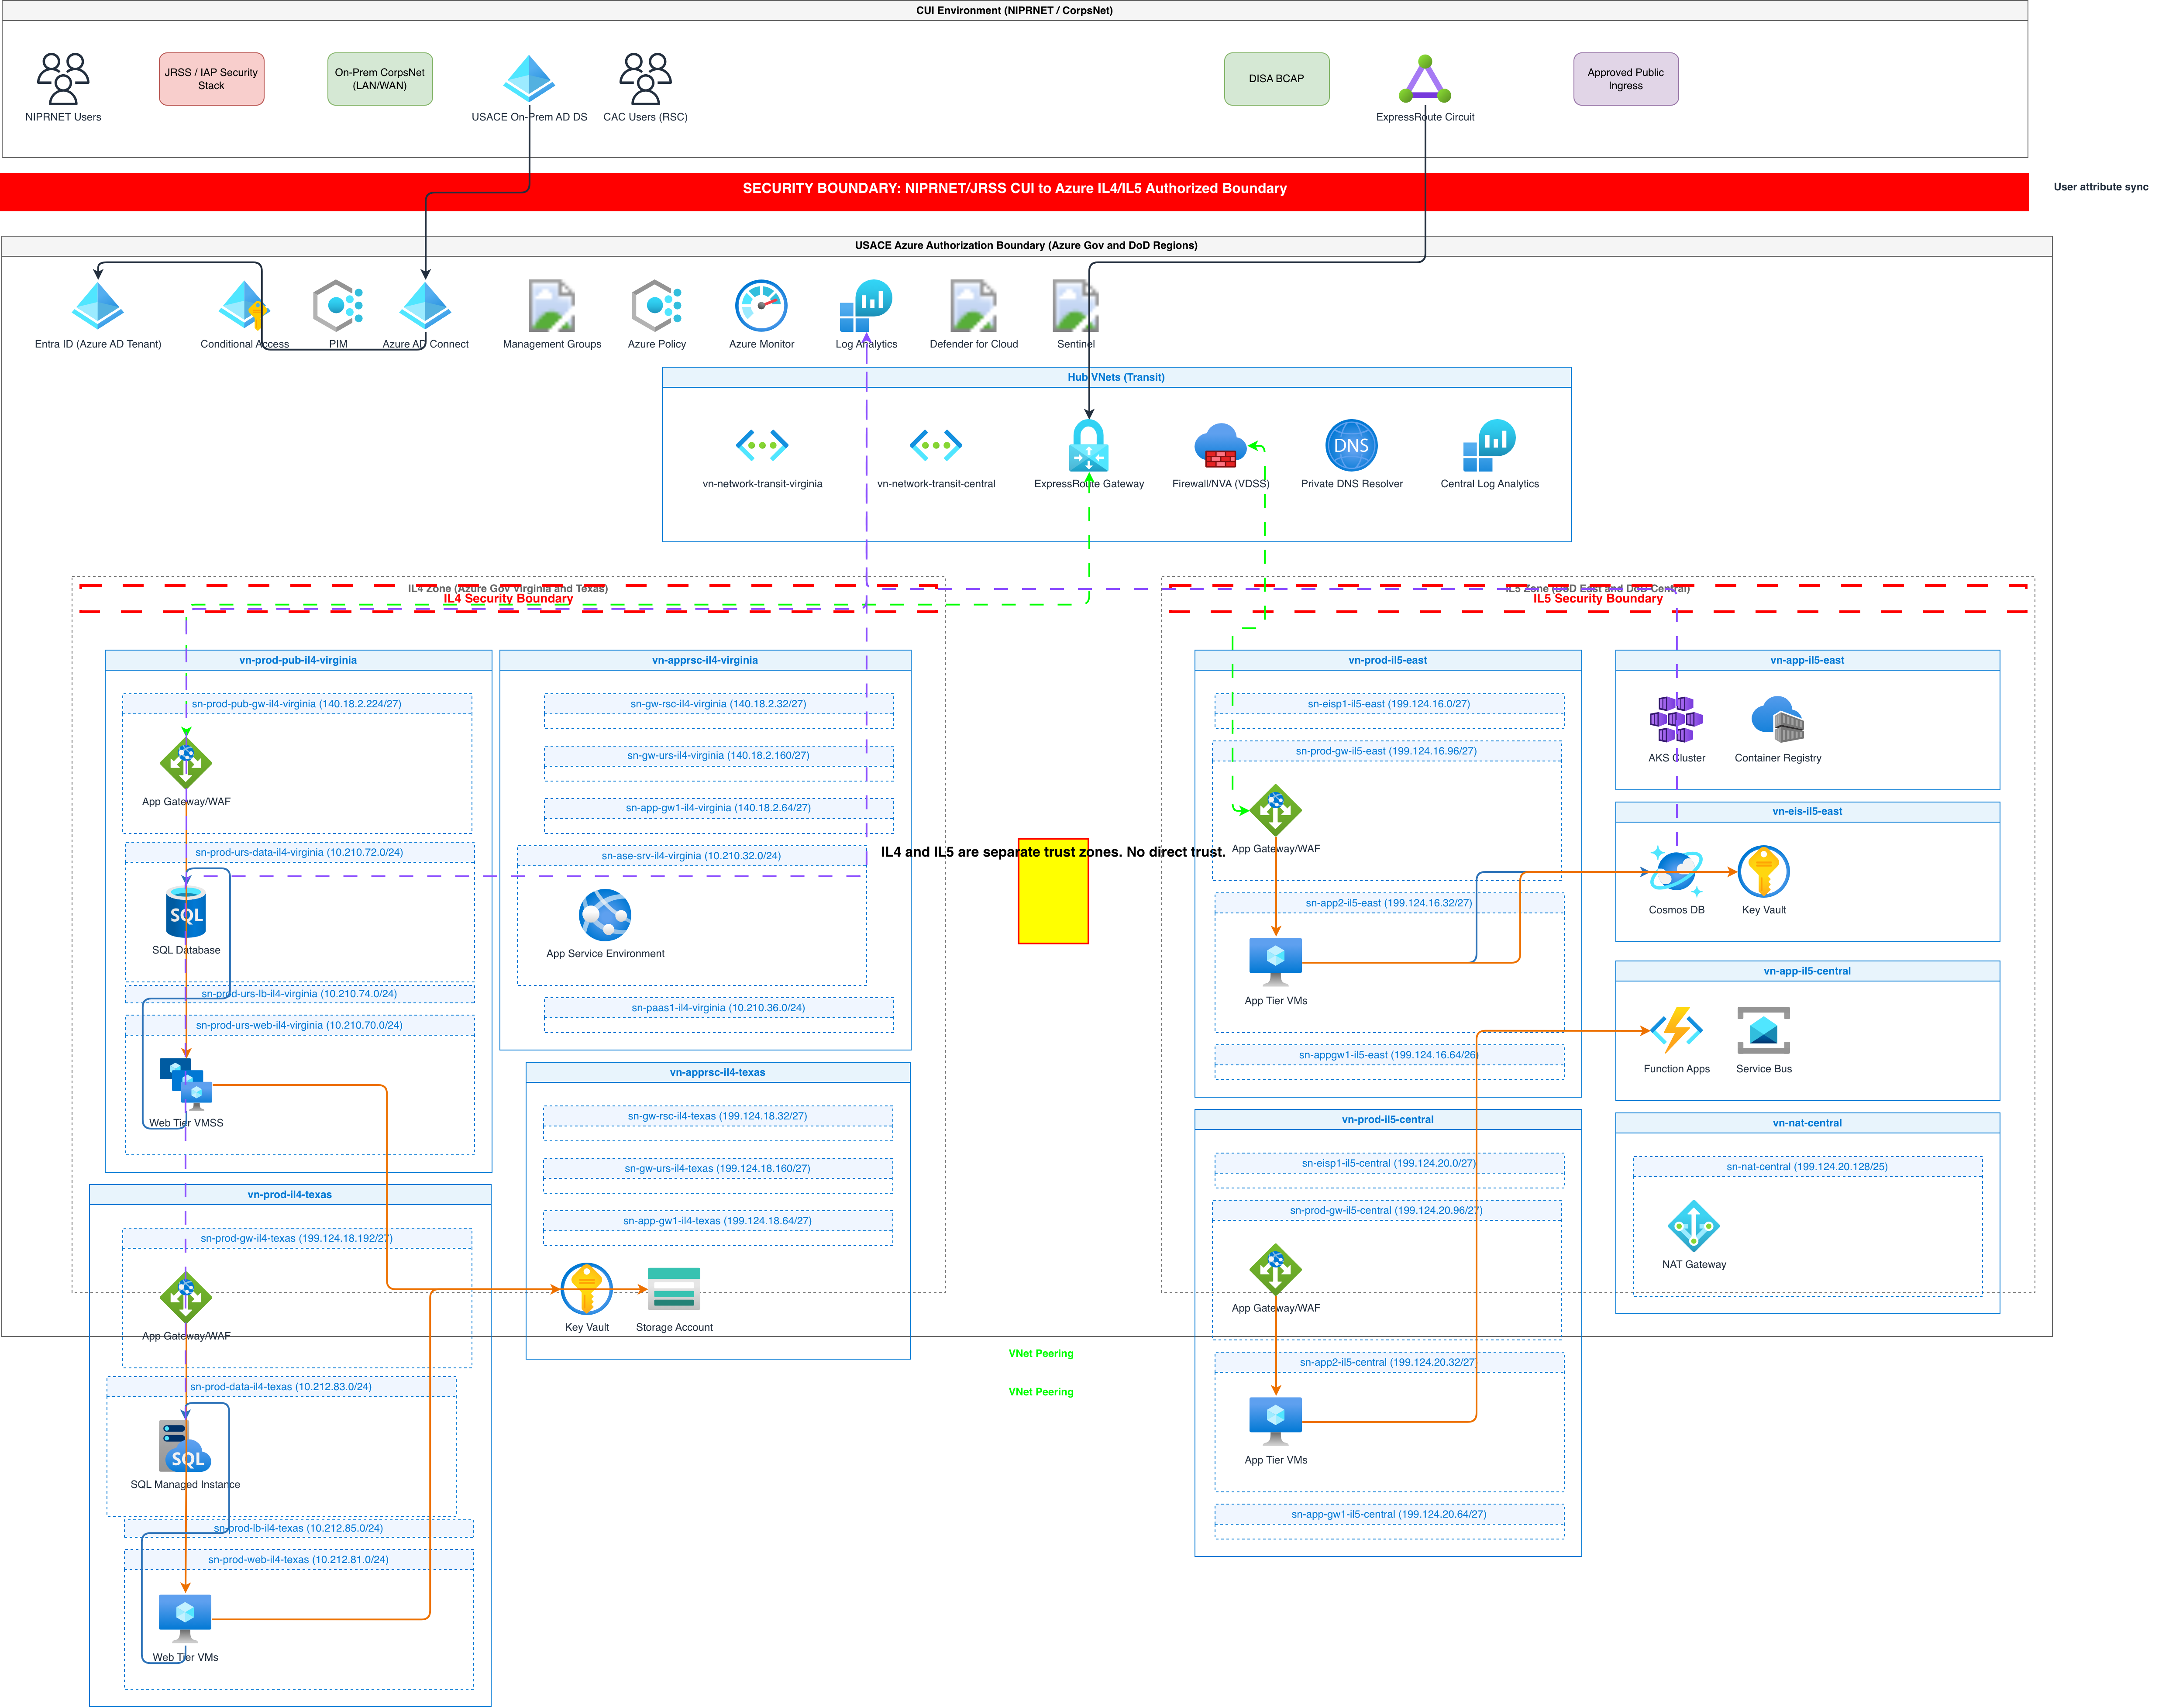

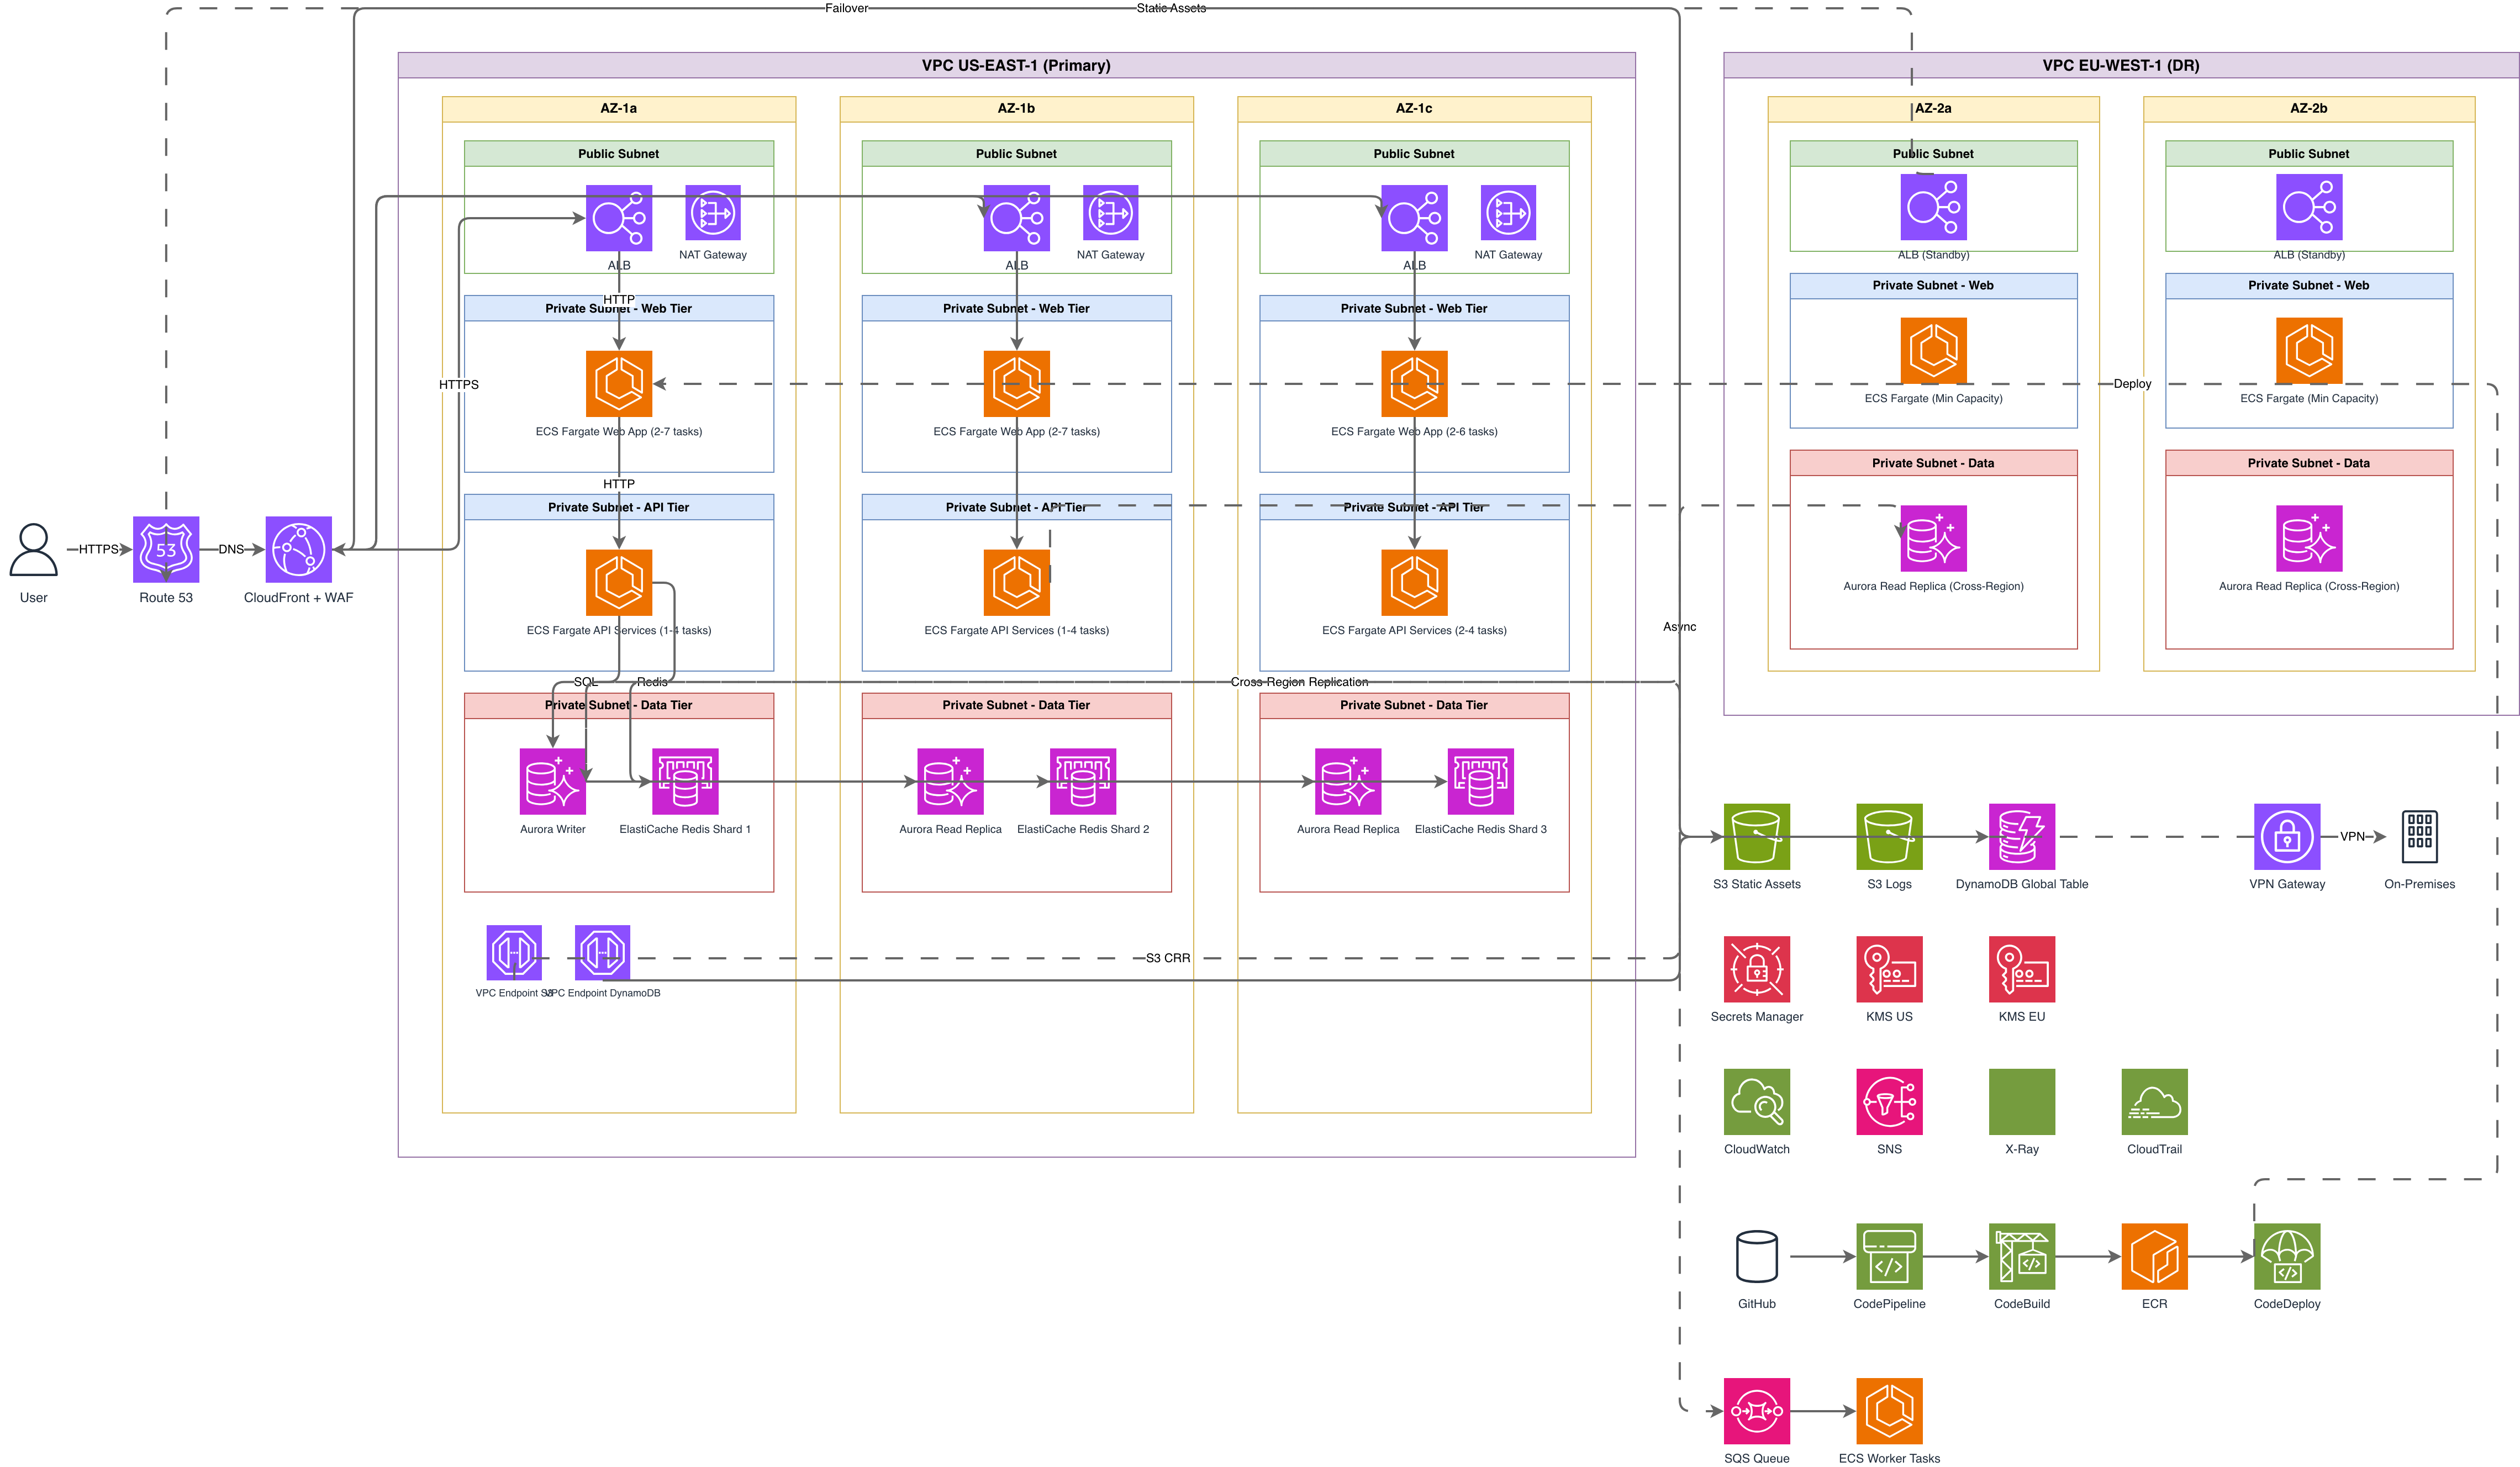
Generate these diagrams with AI
Turn Plain Text into Draw.io Diagrams
Write what you want in English. Skip Mermaid syntax, PlantUML code, and manual drawing. Get a grid-aligned, icon-accurate .drawio file in seconds.
Generate Diagrams with AI, Not Drag-and-Drop
Write what your system does. The AI picks the notation, selects vendor icons, enforces grid alignment, and outputs valid mxGraphModel XML you can open in Draw.io.
Generate Flowcharts from Text with AI
Describe a process in plain English. Get a valid Draw.io flowchart with correct ISO 5807 symbols, decision diamonds, and directional arrows.