Generate System Architecture Diagrams from Text
Describe your system's components in plain English. Get a valid Draw.io diagram with services, databases, message queues, caches, and API connections.
This AI system architecture diagram generator converts plain-text system descriptions into Draw.io diagrams showing how services, databases, caches, and external integrations connect. Describe something like a Next.js frontend calling a FastAPI backend behind an Nginx reverse proxy, with PostgreSQL 15 as the primary datastore, Redis 7 for session caching, RabbitMQ for async job processing, and Stripe webhooks hitting a dedicated ingestion endpoint. The AI places each component with its appropriate icon, draws labeled connections showing protocols and data flow, and groups related services into logical tiers. Grid alignment follows RULE-04. Architecture warnings flag databases without replicas (WARN-03) and public endpoints missing WAF protection (WARN-02). Output is native .drawio XML compatible with Draw.io, Confluence, and VS Code.
What Is an AI System Architecture Diagram Generator?
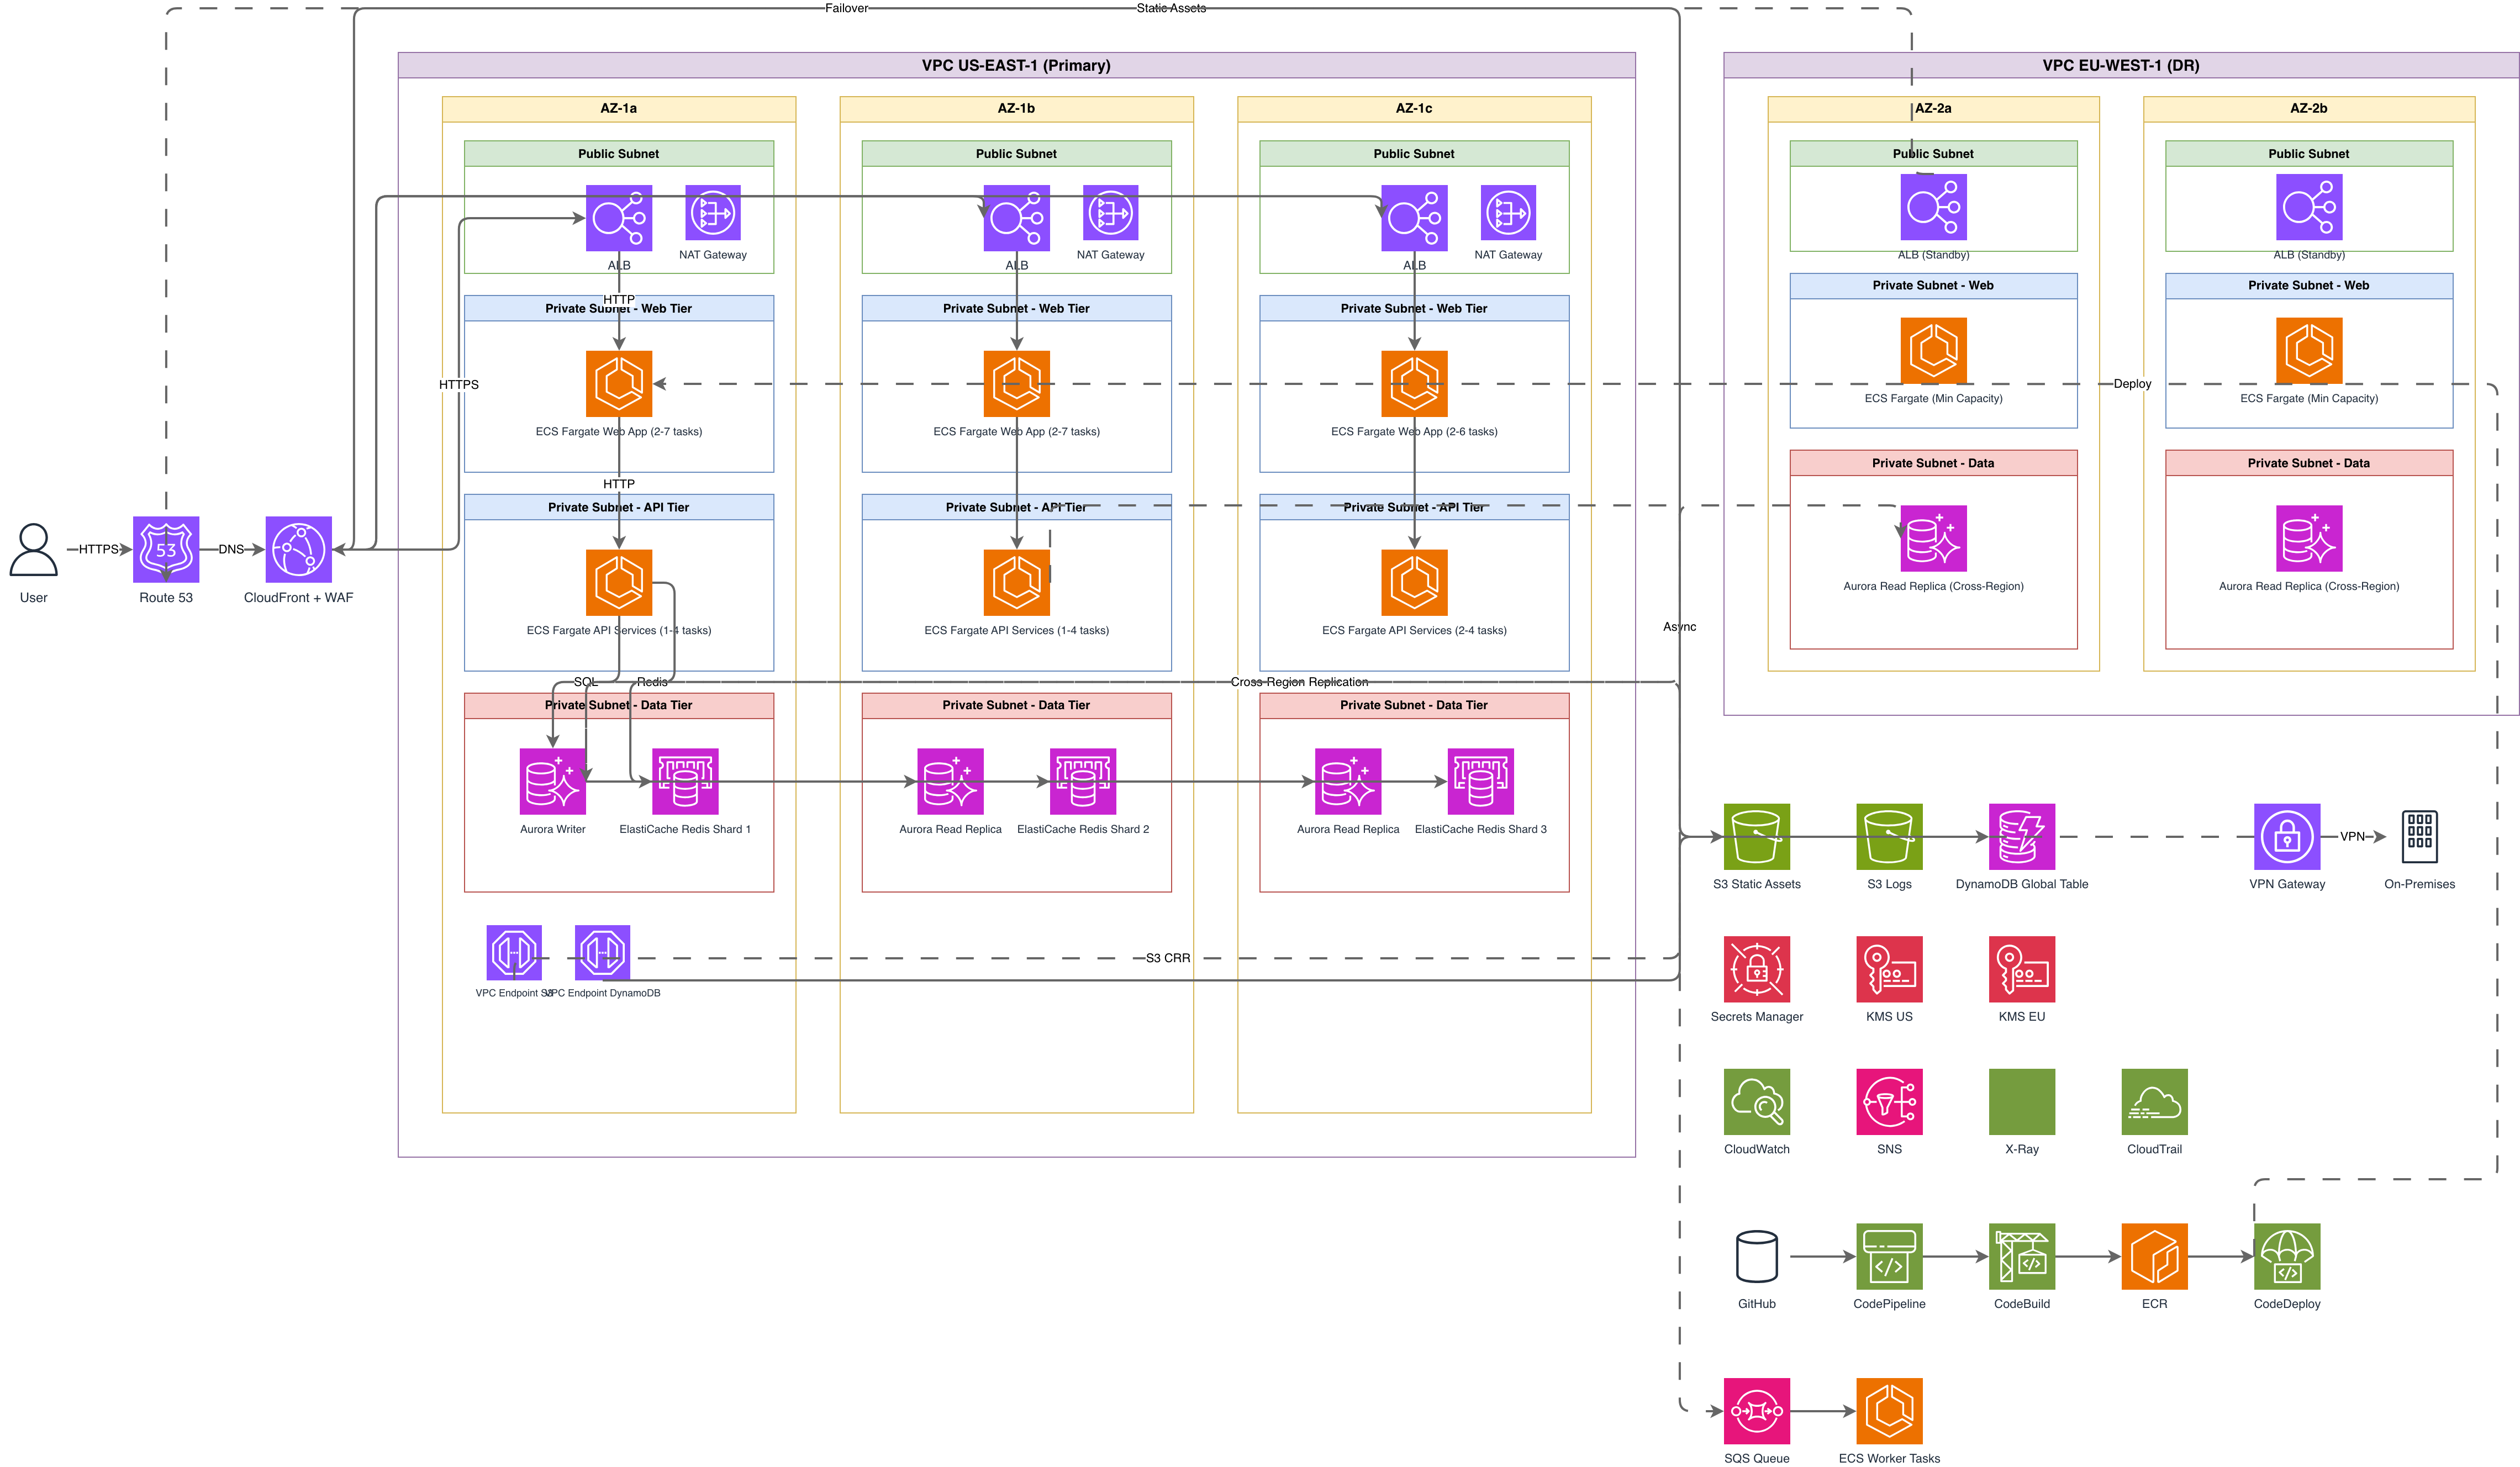
A system architecture diagram provides a high-level view of all major components in a software system and how they communicate. It sits above code-level detail but below infrastructure diagrams. You see application services, databases, caches, message brokers, load balancers, CDNs, external APIs, and the connections between them. Building one manually means selecting shapes, positioning them in logical tiers, routing connection arrows, labeling protocols, and keeping everything aligned. An AI system architecture diagram generator replaces that process. You describe your system: a React frontend served by CloudFront, an API Gateway routing to three Lambda functions, a DynamoDB table with a global secondary index, an SQS queue feeding a worker Lambda, and an SNS topic pushing notifications to a mobile app via Firebase Cloud Messaging. Diagrams.so maps each component to the right icon from its 30+ libraries. RULE-05 enforces left-to-right layout so the diagram reads from client to backend to storage. RULE-06 groups related components: your API Gateway and Lambdas stay together as a compute tier, your DynamoDB and ElastiCache cluster form the data tier. Opinionated mode prevents manual rearrangement that breaks this logical flow. VLM visual validation catches overlapping labels when you pack twenty services into a single diagram. WARN-03 flags any database without a replica. WARN-04 detects missing security boundaries between tiers. The output is .drawio XML. Store it alongside your codebase, review it in pull requests, or export to PNG and SVG for architecture decision records.
Key components
- Application services with protocol labels (REST, gRPC, GraphQL, WebSocket)
- Database instances with engine annotations (PostgreSQL 15, MongoDB 7, DynamoDB)
- Message brokers showing topics, queues, and delivery patterns (RabbitMQ, Kafka, SQS)
- Cache layers with eviction policies (Redis 7 LRU, Memcached, Varnish)
- Load balancers and API gateways with routing rules and rate limit annotations
- External integrations as labeled boundary boxes (Stripe, Twilio, SendGrid, Auth0)
- CDN and static asset layers with origin pull connections
- Tiered grouping containers separating presentation, application, data, and external zones
How to generate with AI
- 1
Describe your system components
Write your system description in plain English. Name every service, database, and integration. For example: 'Next.js 14 frontend behind Cloudflare CDN. FastAPI backend behind an Nginx reverse proxy with rate limiting. PostgreSQL 15 primary with streaming replica. Redis 7 for session cache and rate limit counters. Celery workers consuming from RabbitMQ for PDF generation. Stripe webhooks hit /api/webhooks/stripe. SendGrid handles transactional email. S3 stores user uploads with presigned URLs.'
- 2
Select architecture diagram type
Choose 'Architecture' as the diagram type. Pick a cloud provider if your system runs on a specific platform for provider-specific icons. Leave it on 'General' if the diagram is provider-agnostic. Diagrams.so loads appropriate icons from its 30+ libraries. Enable opinionated mode for consistent left-to-right flow and automatic tier grouping of presentation, application, and data layers.
- 3
Generate and review warnings
Click generate. The AI outputs a .drawio XML file with named service boxes, database cylinders, queue icons, and labeled arrows showing protocols and data direction. Review architecture warnings: WARN-02 for endpoints exposed without WAF, WARN-03 for databases missing replicas, WARN-04 for absent security boundaries between tiers. VLM visual validation flags overlapping component labels. Export to .drawio, PNG, or SVG.
Example prompt
E-commerce platform system architecture: Next.js 14 frontend served by Cloudflare CDN. API Gateway (Kong) routes to four backend services: Product Catalog (Go, gRPC), Order Processing (Java Spring Boot, REST), Payment (Node.js, calls Stripe API and Adyen API), Notification (Python FastAPI, sends via SendGrid and Twilio). PostgreSQL 15 with read replica for Product Catalog and Order Processing. MongoDB 7 for product search with Elasticsearch 8 index. Redis 7 cluster for session cache and cart state. Apache Kafka cluster (3 brokers) with topics: order-created, payment-completed, shipment-updated. Celery workers consume from RabbitMQ for PDF invoice generation. MinIO S3-compatible storage for product images. Keycloak for authentication with OIDC. Prometheus and Grafana for monitoring. Show tier boundaries: CDN/Edge, API Gateway, Application Services, Data Stores, External Services.
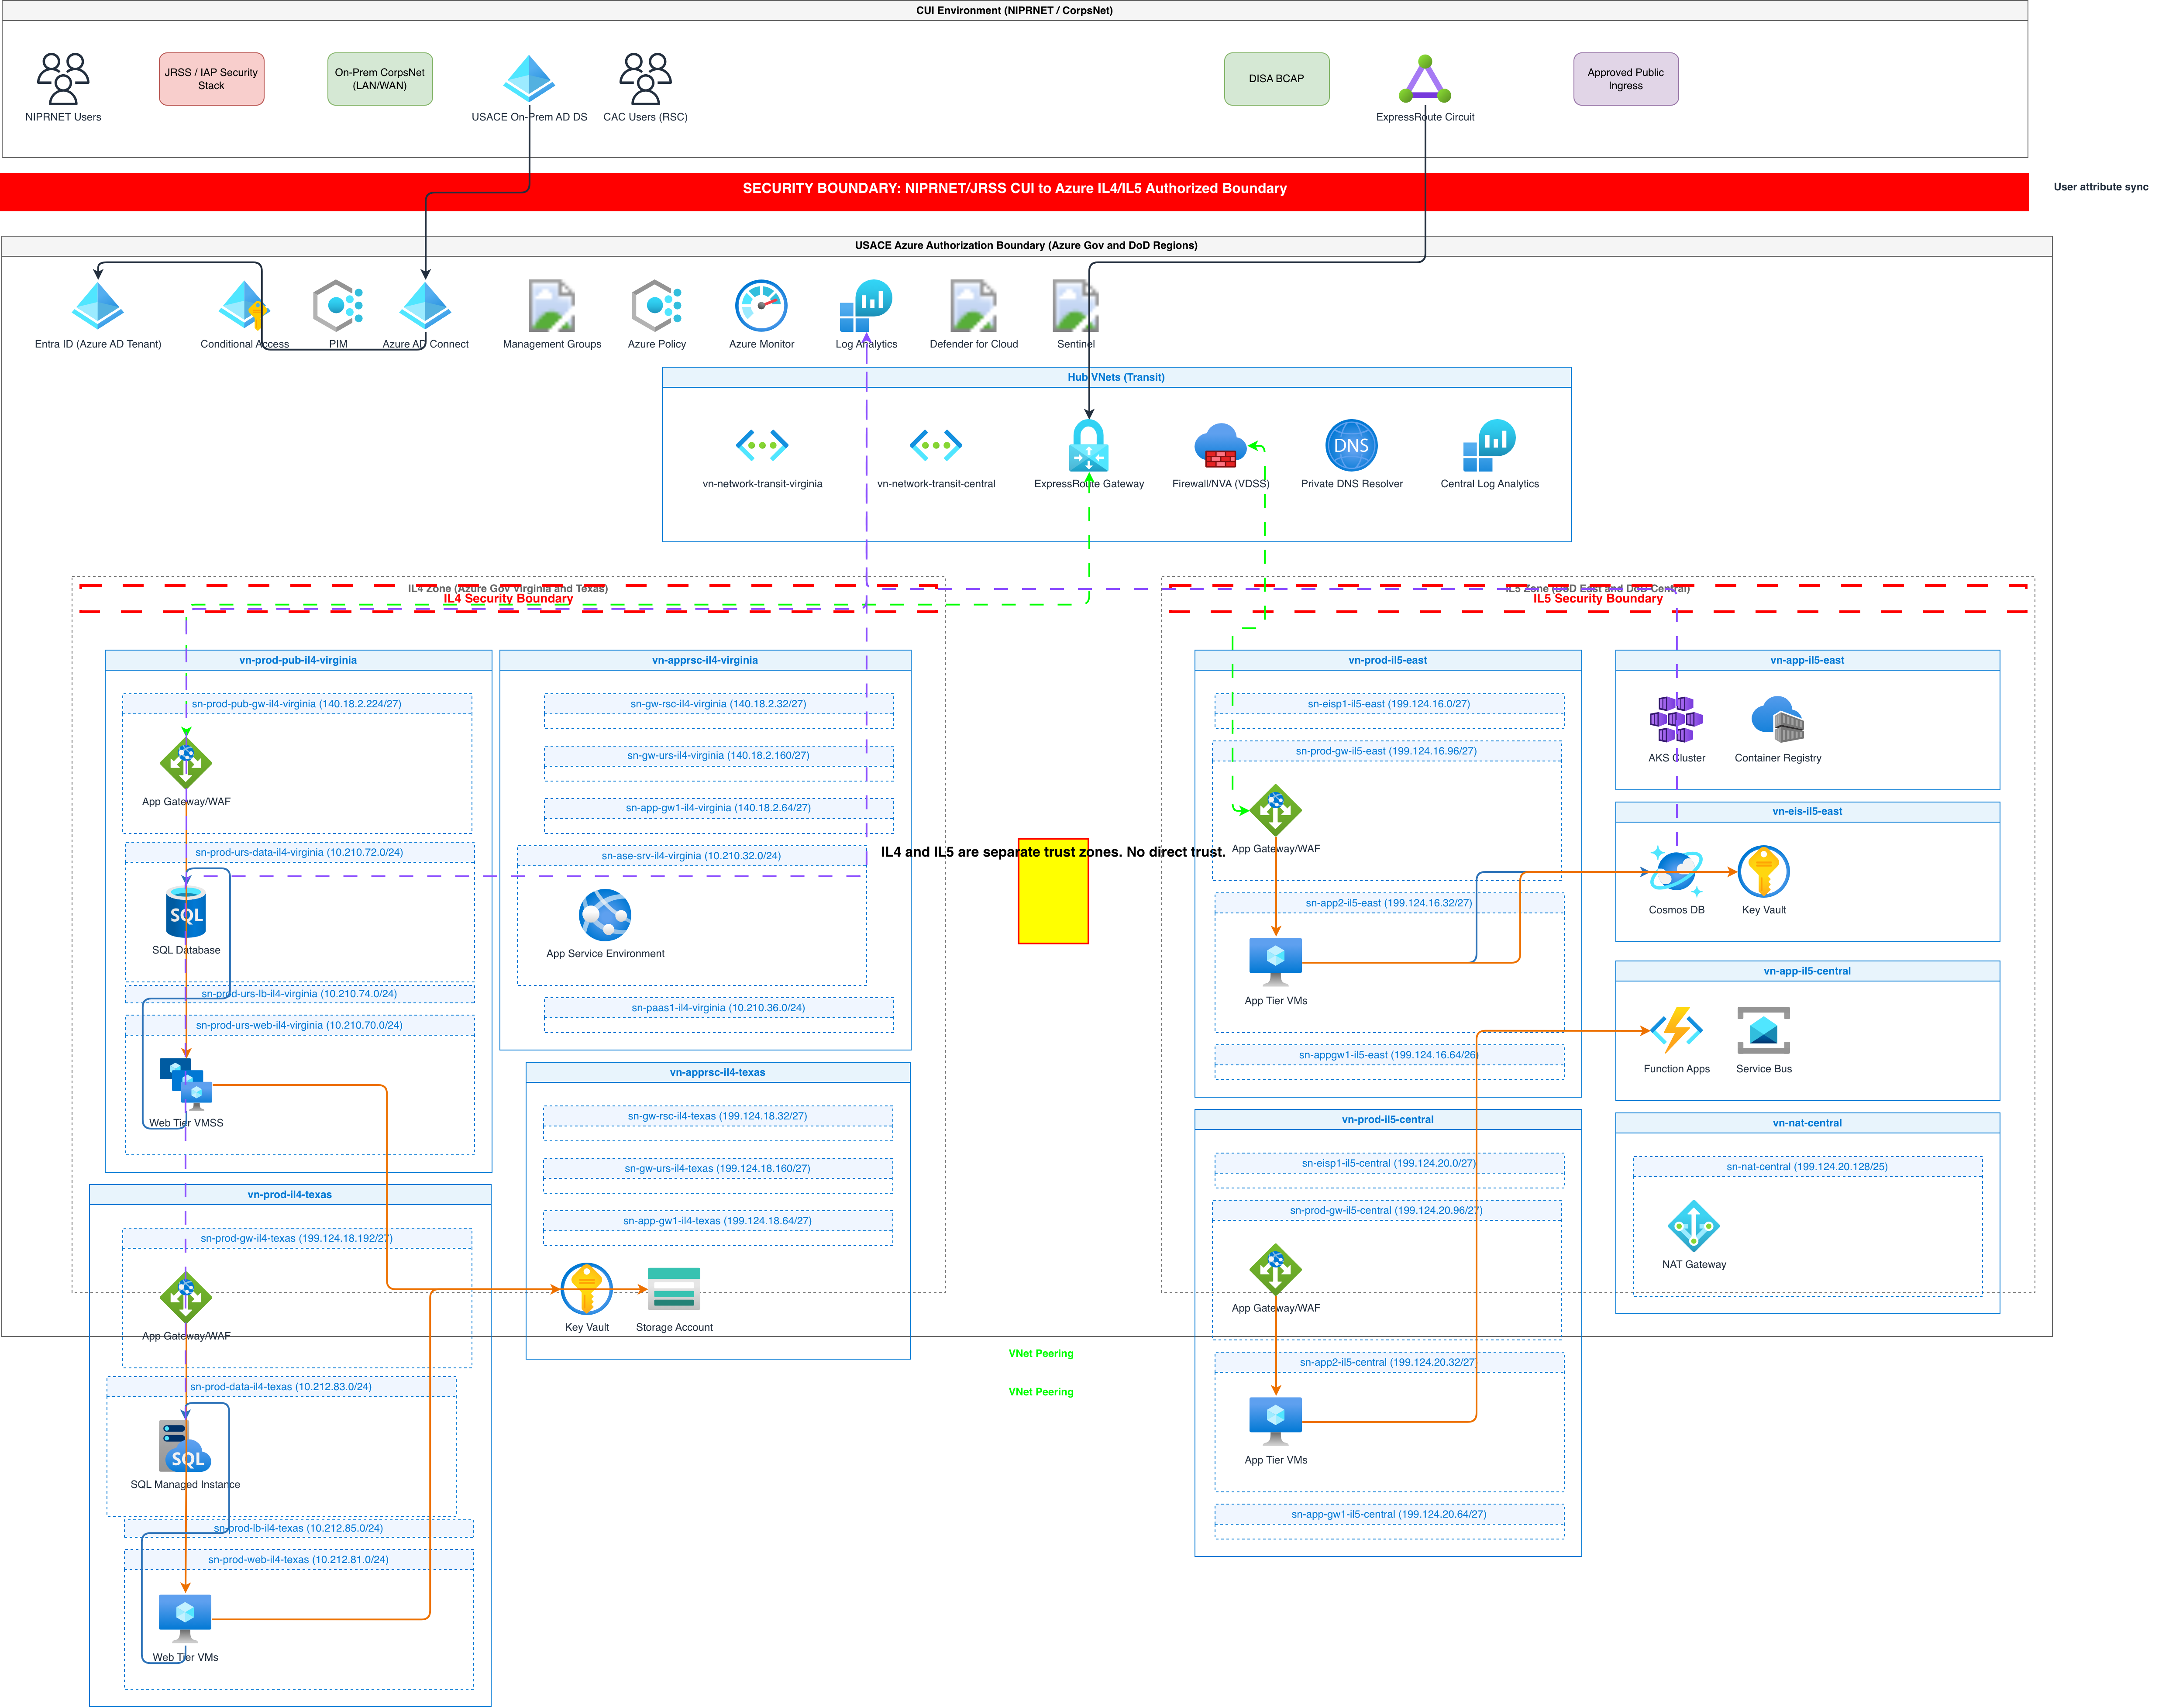
Example diagrams from the gallery


System Architecture Diagram vs C4 Model Diagram vs UML Component Diagram
These three approaches represent system structure at different levels of formality. System architecture diagrams are freeform and audience-flexible. C4 models follow a strict four-level zoom hierarchy. UML component diagrams enforce formal interface and dependency notation defined in UML 2.5.
| Feature | System Architecture Diagram | C4 Model Diagram | UML Component Diagram |
|---|---|---|---|
| Abstraction level | Flexible; shows whatever level of detail the audience needs, from one-box overviews to detailed service maps | Four fixed levels: Context (system), Container (applications), Component (modules), Code (classes) | Single level focused on components, their provided/required interfaces, and inter-component dependencies |
| Notation rules | No formal standard; boxes, cylinders, and arrows with team-specific conventions | Simon Brown's notation: blue for internal systems, gray for external, labeled relationships with protocol/purpose | UML 2.5 specification: component stereotypes, ball-and-socket interface notation, dependency arrows |
| Audience | Everyone from CTO to junior developer; adapts detail level to the room | Engineering teams that need consistent zoom levels; especially useful for onboarding | Software architects and senior developers working on formal design documents or compliance deliverables |
| Tooling support | Any diagramming tool; no special plugin needed; Diagrams.so generates these natively as .drawio | Structurizr DSL, C4-PlantUML, or manual Draw.io with C4 shape library | Enterprise Architect, MagicDraw, PlantUML, or StarUML with a UML 2.5 profile |
| When to avoid | When you need traceable formal interfaces or the audience requires UML compliance for regulatory reasons | When the system is small enough that four levels of zoom add overhead without clarity | When the audience includes non-technical stakeholders who won't understand lollipop interface notation |
When to use this pattern
Use a system architecture diagram when you need a shared visual reference for how your application's components connect. Architecture decision records, sprint planning discussions, and incident post-mortems all benefit from a clear component map. It's the right choice when your audience spans engineering, product, and leadership. If you need formal zoom levels for onboarding documentation, consider a C4 model instead. If compliance requires UML notation, use a UML component diagram. Don't try to fit infrastructure detail like VPCs and subnets into a system architecture diagram. Keep it at the service and database level. Use cloud-specific or network diagrams for infrastructure topology, availability zone placement, and managed service configuration.
Frequently asked questions
What level of detail should I include in my prompt?
Name every service, database, cache, and external integration. Include protocols (REST, gRPC, WebSocket) and specific technology versions (PostgreSQL 15, Redis 7). This AI system architecture diagram generator uses these details to select correct icons and label connections accurately. Skip infrastructure details like subnets and VPCs; those belong in cloud architecture diagrams.
Can the AI generate tiered architecture views?
Yes. Mention your tiers explicitly: presentation, API gateway, application services, data stores, external services. The AI creates labeled containers for each tier and places components inside them following RULE-06. Opinionated mode enforces left-to-right flow from client-facing tiers to backend storage tiers automatically.
How are external integrations shown in the diagram?
External services like Stripe, SendGrid, Twilio, and Auth0 appear as labeled boundary boxes outside your system perimeter. Arrows from internal services to external boxes show the integration protocol and direction. The AI places a security boundary (WARN-04 enforced) between your internal components and third-party services.
What's the difference between system architecture and microservices diagrams?
System architecture diagrams show all components at a high level regardless of architectural style. Microservices diagrams focus specifically on service boundaries, API gateways, message broker choreography, database-per-service patterns, and service mesh sidecars. Use system architecture for the big picture and microservices for service-level detail.
Can I include monitoring and observability components?
Yes. Mention your observability stack in the prompt: Prometheus scraping metrics, Grafana dashboards, Jaeger for distributed tracing, ELK for log aggregation. The AI adds these as components with labeled connections showing data collection paths. They typically appear in a separate monitoring tier or overlay zone.
Related diagram generators
Generate Microservices Architecture Diagrams from Text
Describe your service boundaries in plain English. Get a valid Draw.io diagram with API gateways, message brokers, database-per-service patterns, and service mesh routing.
Generate Cloud Architecture Diagrams from Text
Describe your cloud infrastructure in plain English. Get a valid Draw.io diagram with region boundaries, availability zones, managed services, and DR paths.
Generate Network Diagrams from Text with AI
Describe your network topology in plain English. Get a valid Draw.io diagram with routers, switches, firewalls, VLAN segmentation, and labeled subnet ranges.
Generate API Gateway Diagrams from Text with AI
Describe your API gateway routing, auth, and rate limiting in plain English. Get a valid Draw.io diagram with request flows, middleware chains, and backend services.