Generate Network Diagrams from Text with AI
Describe your network topology in plain English. Get a valid Draw.io diagram with routers, switches, firewalls, VLAN segmentation, and labeled subnet ranges.
This AI network diagram generator converts plain-text topology descriptions into Draw.io network diagrams with standard networking icons. Describe a setup like a Palo Alto PA-5260 firewall fronting two Cisco Catalyst 9300 core switches, VLAN 10 (10.1.10.0/24) for servers, VLAN 20 (10.1.20.0/24) for workstations, and an IPsec VPN tunnel to a remote site over a 100Mbps MPLS link. The AI places each device with its correct icon, draws trunk links between switches, labels interfaces with IP addresses, and segments VLANs into color-coded groups. Grid alignment follows RULE-04. Architecture warnings catch public endpoints without firewalls (WARN-02) and missing security boundaries (WARN-04). The output is native .drawio XML ready for Draw.io, Confluence, or version control.
What Is an AI Network Diagram Generator?
A network diagram maps physical or logical connectivity between devices: routers, switches, firewalls, load balancers, access points, and endpoints. Drawing one manually in Visio or draw.io means hunting through stencil libraries, placing icons, connecting interfaces, labeling IP addresses, and aligning everything on a grid. An AI network diagram generator does this from a text description. You write something like: 'Two Juniper MX480 edge routers running eBGP AS 65001 connect to ISP A and ISP B. Downstream, two Arista 7280R3 core switches in an MLAG pair distribute traffic to four ToR switches across two racks. VLAN 100 (10.10.100.0/24) serves the database tier, VLAN 200 (10.10.200.0/24) serves the application tier.' Diagrams.so parses this and produces a diagram with correct networking icons from its 30+ icon libraries. Each device gets labeled interfaces. Connections show link speeds and protocols. VLANs render as colored boundary groups. The AI follows RULE-05 for left-to-right layout, placing WAN links on the left and LAN segments on the right. Opinionated mode enforces this convention strictly. VLM visual validation detects overlapping cable labels on dense rack diagrams. WARN-02 fires when an endpoint faces the internet without a firewall in the path. WARN-04 triggers for missing DMZ boundaries. The .drawio output supports layered views: toggle physical versus logical overlays in Draw.io to show both perspectives in a single file.
Key components
- Router icons with labeled interfaces, BGP/OSPF AS numbers, and routing protocol annotations
- Switch icons with port channels, LACP bonds, and VLAN trunk labels
- Firewall zones (trust, untrust, DMZ) with policy direction arrows
- VLAN segments as color-coded containers with CIDR notation (e.g., 10.1.10.0/24)
- VPN tunnels shown as dashed lines with IPsec/IKEv2 labels and encryption parameters
- Load balancers with VIP addresses and backend pool member connections
- Wireless access points with SSID labels and controller associations
- WAN links with bandwidth labels (1Gbps, 10Gbps) and ISP/MPLS annotations
How to generate with AI
- 1
Describe your network topology
Write your network layout in plain English. Include device types, interface names, IP addresses, and protocols. For example: 'Palo Alto PA-5260 firewall with three zones: untrust (eth1/1, 203.0.113.1/30 to ISP), trust (eth1/2, 10.0.0.1/24 to core switch), DMZ (eth1/3, 172.16.0.1/24). Core switch is a Cisco Catalyst 9500 with VLAN 10 for servers and VLAN 20 for users. OSPF area 0 between firewall and core switch.'
- 2
Select network diagram type
Choose 'Network' as the diagram type. Diagrams.so loads networking-specific icon libraries with standard symbols for routers, switches, firewalls, load balancers, and endpoints. Enable opinionated mode if you want the AI to enforce WAN-to-LAN left-to-right layout and auto-group devices by VLAN or physical rack location. Skip the cloud provider selector unless your network includes cloud VPCs.
- 3
Generate and refine
Click generate. The AI outputs a .drawio XML with device icons, interface labels, subnet annotations, and VLAN groupings. Architecture warnings flag exposed endpoints missing firewalls (WARN-02) and networks without security zone boundaries (WARN-04). VLM visual validation catches overlapping interface labels on dense topologies. Download as .drawio for editing, or export to PNG or SVG for documentation.
Example prompt
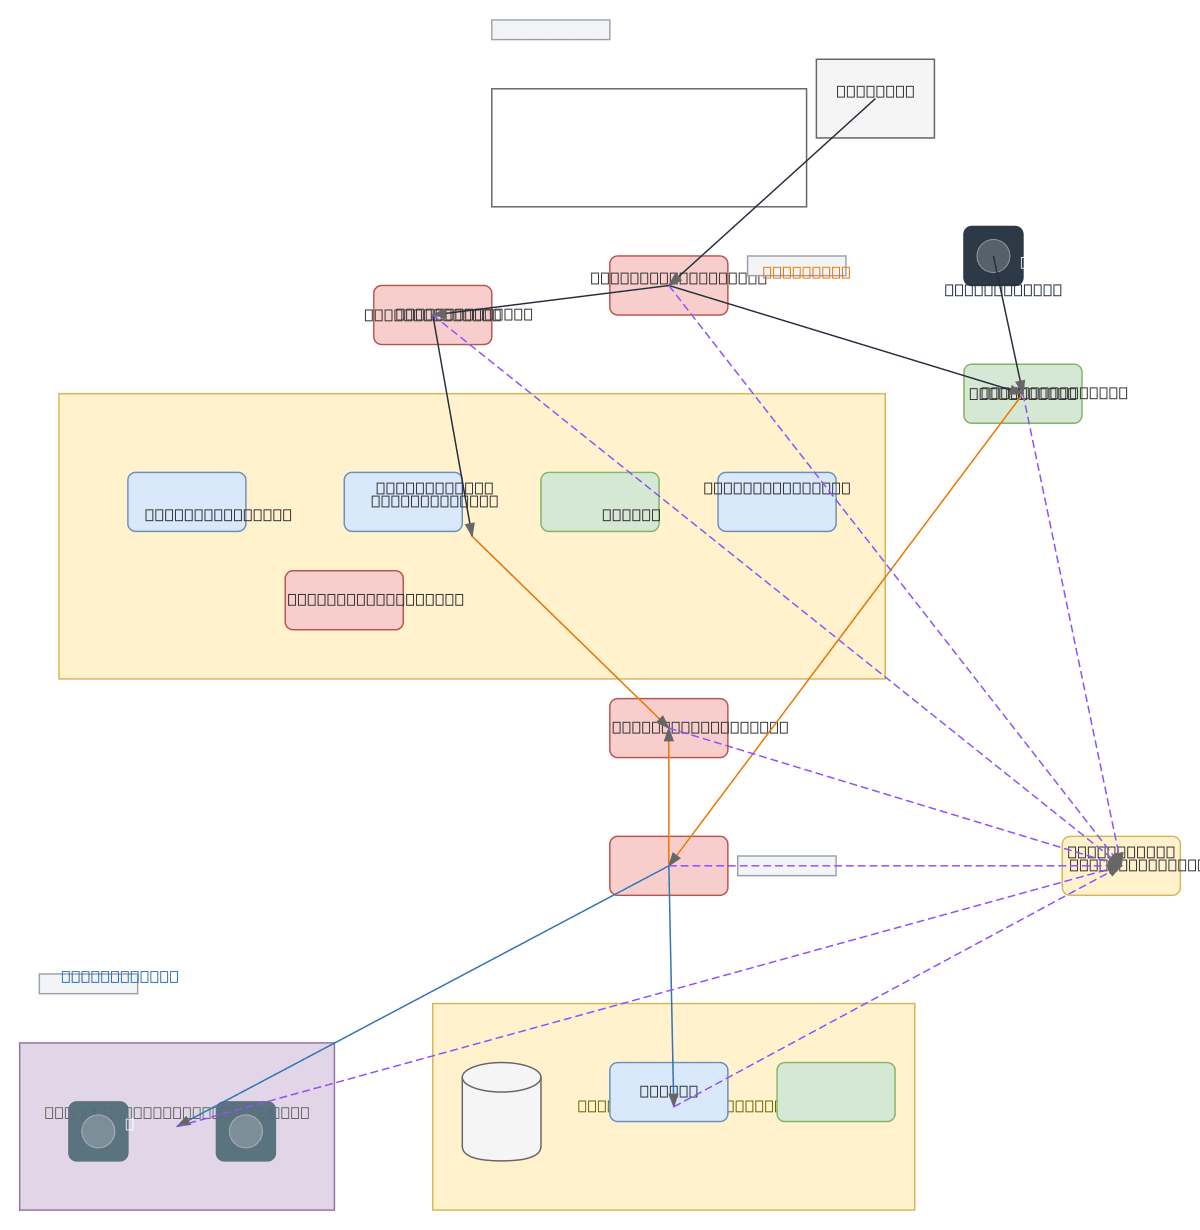
Enterprise campus network: Two ISP uplinks (Lumen 1Gbps, AT&T 1Gbps) terminate on a Palo Alto PA-5260 HA pair in active/passive. Untrust zone eth1/1 and eth1/2 face ISPs with eBGP AS 65100. Trust zone eth1/3 connects to a Cisco Catalyst 9500 core switch pair in VSS. Core switches run OSPF area 0. Distribution layer: four Catalyst 9300 switches, two per building. Access layer: 24 Meraki MS250 switches. VLANs: 10 (10.1.10.0/24 servers), 20 (10.1.20.0/24 workstations), 30 (10.1.30.0/24 voice), 40 (10.1.40.0/24 guest with captive portal). DMZ zone eth1/4 (172.16.0.0/24) hosts a reverse proxy and mail gateway. Site-to-site IPsec VPN tunnel to branch office over the Lumen link. Wireless: Cisco 9800 WLC managing 40 Catalyst 9120AXI access points on channels 1, 6, 11. Show DHCP relay from access switches to a Windows DHCP server in VLAN 10.
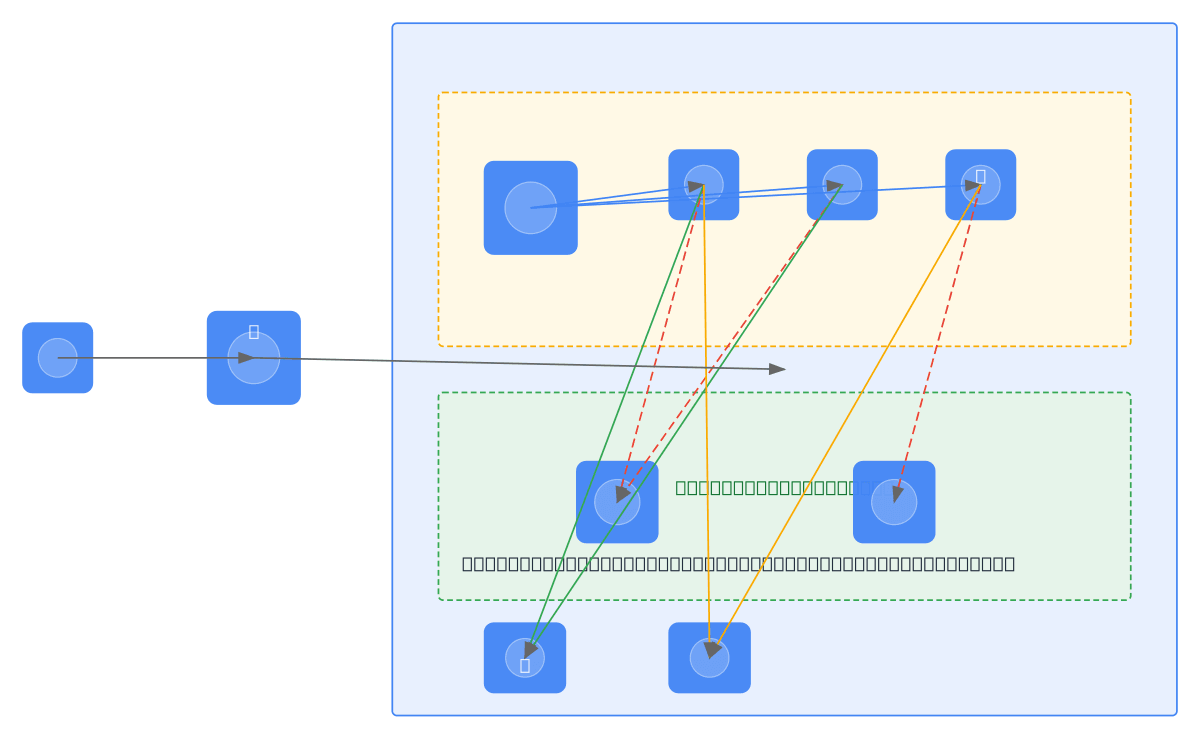
Example diagrams from the gallery


Physical Network Diagram vs Logical Network Diagram vs Cloud Network Diagram
Network diagrams come in three main flavors. Physical diagrams show actual hardware, cabling, and rack positions. Logical diagrams abstract away the hardware and focus on IP addressing, VLANs, and routing. Cloud network diagrams replace physical devices with managed services and virtual constructs like VPCs and subnets.
| Feature | Physical Network Diagram | Logical Network Diagram | Cloud Network Diagram |
|---|---|---|---|
| Primary focus | Hardware placement, cable runs, patch panel ports, rack unit positions, and power distribution | IP addressing, VLAN segmentation, routing protocols (BGP, OSPF), and traffic flow direction | VPCs, subnets, availability zones, security groups, route tables, and managed service connections |
| Device representation | Specific vendor hardware: Cisco Catalyst 9300, Palo Alto PA-5260, with model numbers and port counts | Generic router/switch/firewall symbols labeled with function, not vendor or model | Cloud-native icons: AWS VPC, Azure VNet, GCP Shared VPC, with provider-specific symbols |
| Connection details | Cable types (Cat6a, fiber OM4), port numbers (Gi0/1), link speeds, and physical distances | Protocol relationships (BGP peer, OSPF adjacency), VLAN tags, and subnet assignments | VPC peering, Transit Gateway attachments, private endpoints, and internet gateway routes |
| Grouping method | Racks, rooms, floors, buildings, and campus boundaries with geographic layout | Broadcast domains, VLAN groups, routing areas, and security zones (trust/DMZ/untrust) | Regions, availability zones, VPCs, subnets (public/private), and resource groups |
| Audience | Data center technicians, cabling contractors, and facilities managers doing rack-and-stack | Network engineers configuring routing, security architects designing zone policies | Cloud architects, DevOps engineers, and compliance auditors reviewing cloud posture |
| Change frequency | Updated during hardware refresh cycles, rack moves, or new site buildouts | Updated when VLANs, subnets, or routing policies change; more frequent than physical | Updated with every Terraform/CloudFormation change; often generated from IaC state |
When to use this pattern
Use a network diagram when you need to document device connectivity, IP addressing, or traffic paths across your infrastructure. Physical diagrams suit data center buildouts and cabling audits. Logical diagrams fit security reviews, firewall rule documentation, and VLAN planning. Choose a cloud network diagram when your topology lives entirely in AWS, Azure, or GCP. If your focus is on application-level service communication rather than Layer 2/3 connectivity, a system architecture or microservices diagram is a better fit. Don't overload a network diagram with application logic. Keep it focused on devices, interfaces, and protocols. For wireless site surveys, pair the network diagram with a floor plan overlay.
Frequently asked questions
What network devices does the AI network diagram generator support?
This AI network diagram generator supports routers, switches (core, distribution, access, ToR), firewalls, load balancers, wireless controllers, access points, VPN concentrators, and generic endpoints. Diagrams.so's 30+ icon libraries include standard networking symbols. Specify vendor and model in your prompt for precise icon matching.
Can I show VLANs and subnets in the diagram?
Yes. Specify VLAN IDs and CIDR ranges in your prompt. The AI renders each VLAN as a labeled, color-coded container. Devices appear inside their assigned VLAN group. Trunk links between switches show tagged VLAN lists. Subnet ranges display as annotations on each VLAN boundary with dotted notation.
How does the AI handle VPN tunnels and WAN links?
VPN tunnels render as dashed lines with IPsec or WireGuard labels. WAN links show as connections with bandwidth annotations. Specify the tunnel endpoints and encryption type in your prompt. The AI places tunnel endpoints on the correct firewall or router interfaces and labels the link with IKE version and cipher suite.
What architecture warnings apply to network diagrams?
WARN-02 fires when a host or service is reachable from the internet without a firewall or WAF in the path. WARN-04 triggers when the topology lacks explicit security zone boundaries like DMZ, trust, or untrust segments. WARN-01 flags single-path designs without redundant links or failover paths.
Can I create both physical and logical views from one prompt?
You can generate each view separately by adjusting your prompt emphasis. Describe rack positions and cable types for a physical diagram. Describe IP addressing and routing protocols for a logical one. Draw.io supports layers, so you can combine both outputs into a single file with toggleable physical and logical overlays.
Related diagram generators
Generate Cloud Architecture Diagrams from Text
Describe your cloud infrastructure in plain English. Get a valid Draw.io diagram with region boundaries, availability zones, managed services, and DR paths.
Generate Security Architecture Diagrams from Text with AI
Describe your trust boundaries, encryption layers, and access controls in plain English. Get a valid Draw.io security diagram with defense-in-depth zones.
Generate System Architecture Diagrams from Text
Describe your system's components in plain English. Get a valid Draw.io diagram with services, databases, message queues, caches, and API connections.
Generate AWS architecture diagrams from text
Describe your AWS infrastructure in plain English. Get a valid Draw.io diagram with official AWS icons, VPC boundaries, and Multi-AZ placement.