Generate Cloud Architecture Diagrams from Text
Describe your cloud infrastructure in plain English. Get a valid Draw.io diagram with region boundaries, availability zones, managed services, and DR paths.
This AI cloud architecture diagram generator converts plain-text infrastructure descriptions into Draw.io diagrams that work across AWS, Azure, GCP, or multi-cloud setups. Describe something like a primary region in us-east-1 with an ALB fronting ECS Fargate tasks, RDS PostgreSQL with Multi-AZ failover, and an S3 bucket replicating to us-west-2 for disaster recovery. The AI draws region containers, places services in the correct availability zones, and routes traffic paths with protocol labels. Every element aligns to a 10px grid per RULE-04. Architecture warnings flag single-AZ deployments (WARN-01), missing WAF on public endpoints (WARN-02), and databases without replicas (WARN-03). Output is native .drawio XML you can open anywhere Draw.io runs. No vendor lock-in on the diagram itself.
What Is an AI Cloud Architecture Diagram Generator?
A cloud architecture diagram maps how managed services, networking, storage, and compute resources connect across regions and availability zones in one or more cloud providers. Drawing one from scratch means navigating provider-specific icon sets, creating nested containers for regions and AZs, routing traffic through load balancers and gateways, and keeping everything aligned. An AI cloud architecture diagram generator handles this from a text prompt. You describe your infrastructure: an AWS primary region (us-east-1) with a VPC spanning three AZs, an Application Load Balancer distributing to ECS Fargate tasks, RDS PostgreSQL 15 with Multi-AZ standby, ElastiCache Redis 7 in cluster mode, and a DR region (us-west-2) with S3 cross-region replication and a Route 53 failover record. Diagrams.so selects the correct provider icons from its 30+ icon libraries. If you mention services from multiple providers, it loads AWS, Azure, and GCP icon sets together. RULE-06 groups resources by region and AZ automatically. RULE-05 enforces left-to-right layout from internet ingress to backend storage. Opinionated mode locks this layout. VLM visual validation catches overlapping icons in dense multi-region diagrams. WARN-01 detects single-AZ compute. WARN-02 flags internet-facing load balancers missing AWS WAF or Cloud Armor. WARN-03 triggers on standalone databases without read replicas or standby instances. The .drawio output is portable. Store it in Git, embed it in Confluence, or export to PNG and SVG for architecture review boards.
Key components
- Region containers with labeled geographic identifiers (us-east-1, westeurope, asia-southeast1)
- Availability zone groups showing resource distribution across fault domains
- Managed compute services (ECS Fargate, AKS, Cloud Run) with scaling annotations
- Database instances with replication arrows showing primary/standby/read-replica topology
- Object storage buckets with cross-region replication and lifecycle policy labels
- Load balancers and CDN layers with health check paths and SSL termination indicators
- DR failover paths with RTO/RPO annotations and Route 53/Traffic Manager/Cloud DNS routing
- VPC/VNet/VPC peering connections with CIDR range labels and security group references
How to generate with AI
- 1
Describe your cloud infrastructure
Write your architecture in plain English. Specify providers, regions, and services. For example: 'AWS primary region us-east-1: VPC 10.0.0.0/16 with public subnets in AZ-a and AZ-b. ALB routing to ECS Fargate cluster running three services. RDS PostgreSQL 15 Multi-AZ in private subnets. ElastiCache Redis 7 cluster. DR region us-west-2 with S3 cross-region replication and RDS read replica. Route 53 failover routing between regions. CloudFront distribution with WAF rules.'
- 2
Select cloud provider or leave General
Pick a specific cloud provider for single-cloud diagrams, or leave it on 'General' for multi-cloud and hybrid layouts. Diagrams.so loads the matching icon libraries. For multi-cloud, mention each provider's services by name and the AI loads all relevant icon sets. Choose 'Architecture' as the diagram type. Enable opinionated mode for consistent region-to-region flow.
- 3
Generate and review DR paths
Click generate. The AI produces a .drawio XML file with region containers, AZ groupings, service icons, and labeled connections. Architecture warnings highlight risks: WARN-01 for single-AZ compute, WARN-02 for public endpoints without WAF, WARN-03 for databases without replicas. VLM visual validation checks for overlapping labels in multi-region layouts. Download as .drawio, PNG, or SVG for architecture review boards.
Example prompt
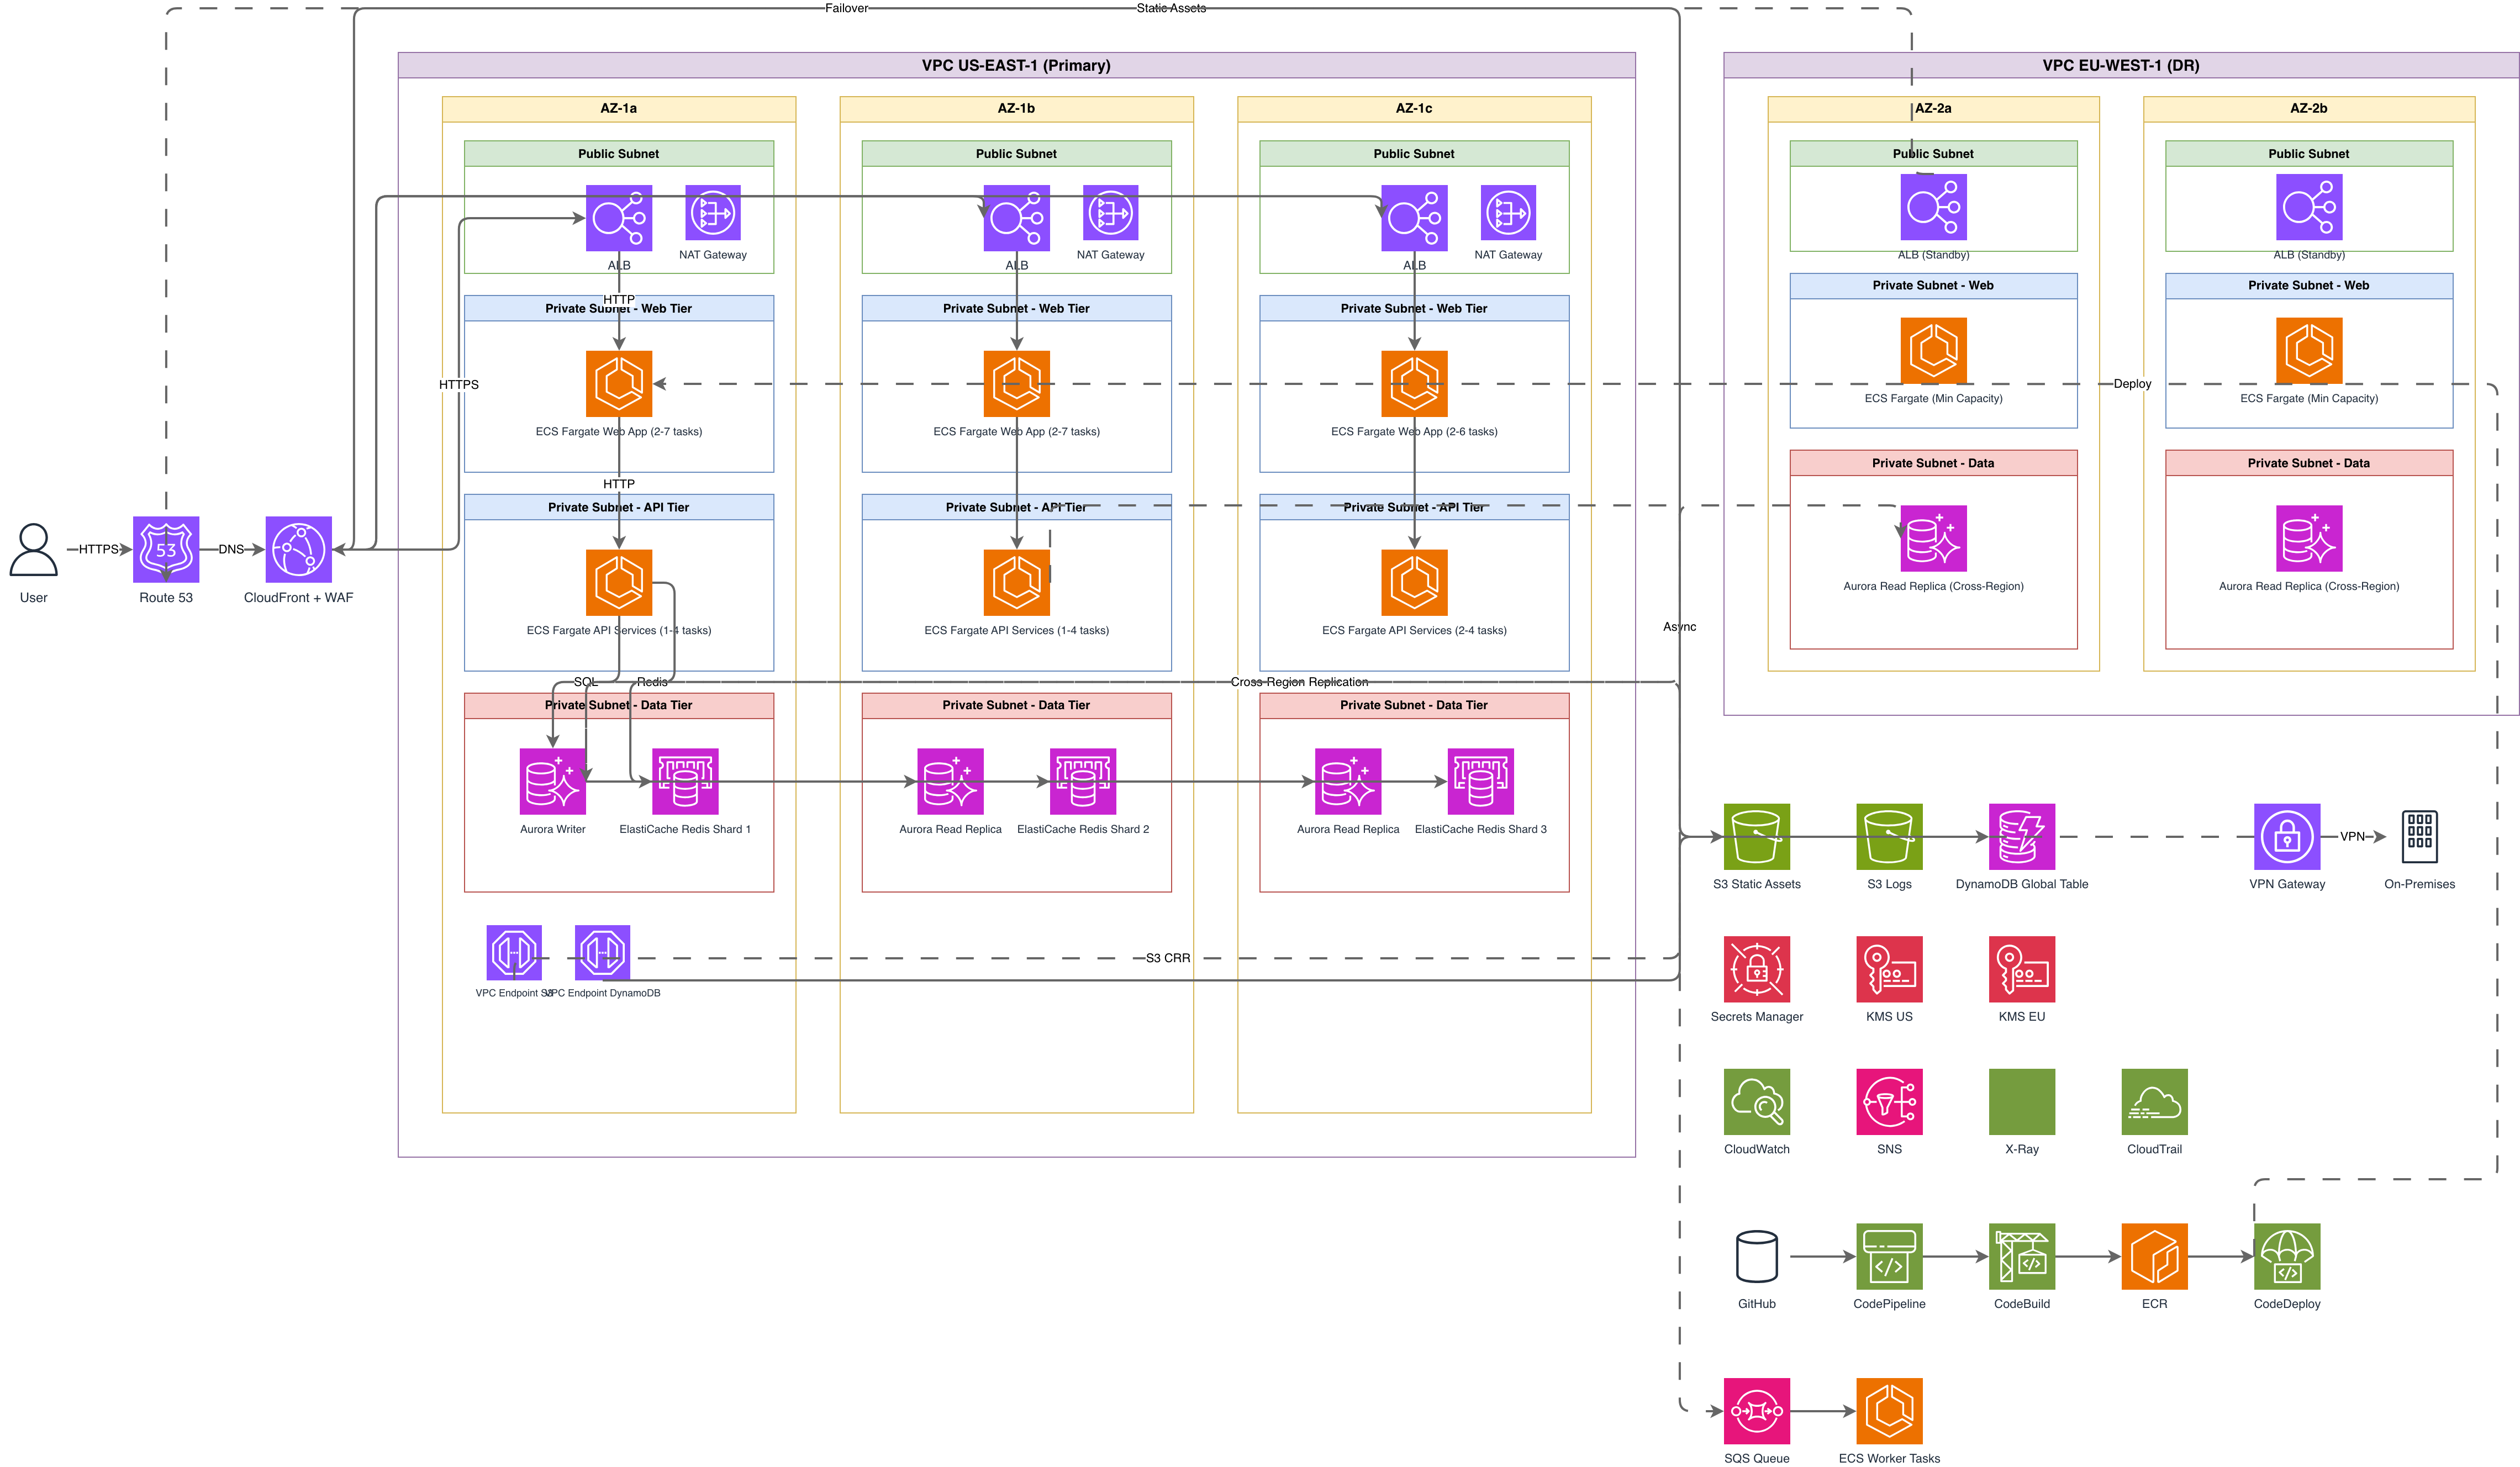
Multi-region AWS architecture with DR: Primary region us-east-1 with VPC 10.0.0.0/16. Public subnets 10.0.1.0/24 and 10.0.2.0/24 in AZ-a and AZ-b. Private subnets 10.0.10.0/24 and 10.0.20.0/24. ALB in public subnets with AWS WAF. ECS Fargate cluster running three services: api-gateway, order-service, notification-service. RDS PostgreSQL 15 Multi-AZ primary in private subnets. ElastiCache Redis 7 cluster mode with two shards. S3 bucket 'app-assets' with cross-region replication to us-west-2 bucket 'app-assets-dr'. DR region us-west-2: VPC 10.1.0.0/16, RDS read replica promoted on failover, ECS Fargate standby cluster with minimum tasks. Route 53 failover routing policy pointing to both ALBs. CloudFront distribution origin to us-east-1 ALB. NAT Gateway in each AZ for private subnet egress. Show RTO of 15 minutes and RPO of 1 minute on the DR failover path.
Example diagrams from the gallery


Single-Cloud Architecture vs Multi-Cloud Architecture vs Hybrid Cloud Architecture
Cloud architecture diagrams differ based on how many providers and environments are involved. Single-cloud keeps everything in one provider. Multi-cloud distributes workloads across two or more providers. Hybrid cloud connects on-premises infrastructure to one or more cloud providers. Each approach changes what the diagram must communicate.
| Feature | Single-Cloud Architecture | Multi-Cloud Architecture | Hybrid Cloud Architecture |
|---|---|---|---|
| Provider scope | One provider (AWS, Azure, or GCP); all services use that provider's managed offerings | Two or more providers; e.g., compute on AWS, analytics on GCP BigQuery, identity on Azure Entra ID | On-premises data center connected to one or more cloud providers via VPN or dedicated interconnect |
| Network complexity | VPC peering or Transit Gateway within one provider; well-documented CIDR planning | Cross-provider networking via VPN tunnels, Megaport, or Equinix Cloud Exchange; overlapping CIDR risk | Direct Connect, ExpressRoute, or Cloud Interconnect to on-prem; firewall rules bridging two environments |
| Identity and access | One IAM system: AWS IAM, Azure RBAC, or GCP IAM with service accounts and roles | Federated identity across providers; OIDC trust between AWS IAM and GCP Workload Identity Federation | Active Directory on-prem synced to cloud identity (Entra ID Connect, AWS SSO with AD Connector) |
| DR strategy | Multi-region within the same provider; RDS read replicas, S3 cross-region replication, Route 53 failover | Cross-provider failover; primary on AWS, standby on GCP; requires portable workloads (containers, Terraform) | Cloud as DR for on-prem or vice versa; Zerto/Veeam replication to cloud VMs; longer RTO than cloud-native DR |
| Diagram icon sets | One provider's icon library; clean and consistent visual language | Multiple provider icon sets on one canvas; Diagrams.so loads all relevant libraries automatically | Mix of cloud icons and on-premises symbols (rack servers, SAN, physical firewall) on the same diagram |
When to use this pattern
Use a cloud architecture diagram when you need to communicate region placement, availability zone distribution, managed service selection, and disaster recovery strategy. It's the right diagram for architecture review boards, compliance documentation, and cost optimization discussions where you need to see which services run in which regions. If your focus is on application-level service communication rather than cloud infrastructure, use a system architecture diagram. For provider-specific deep dives into GCP Projects, AWS Accounts, or Azure Subscriptions, use the dedicated provider diagram generators. Don't overload a cloud architecture diagram with application business logic. Keep it focused on infrastructure topology, networking, and managed service placement.
Frequently asked questions
Can this AI cloud architecture diagram generator handle multi-cloud setups?
Yes. Name services from multiple providers in your prompt: AWS ECS, GCP BigQuery, Azure Entra ID. This AI cloud architecture diagram generator loads all relevant icon libraries automatically from its 30+ available sets. Each provider's services render with their official icons. Cross-cloud connections show as labeled arrows with VPN or interconnect annotations.
How does the AI represent disaster recovery paths?
Describe your DR setup: primary region, DR region, replication method, and failover trigger. The AI draws both regions as containers with replication arrows between them. Failover paths get labeled with RTO and RPO values. DNS failover records (Route 53, Traffic Manager) appear as routing nodes between the regions.
What architecture warnings are specific to cloud diagrams?
WARN-01 flags single-AZ deployments where all compute runs in one availability zone. WARN-02 catches internet-facing load balancers or API gateways without WAF protection. WARN-03 triggers on databases without read replicas or Multi-AZ standby. WARN-04 flags missing VPC security boundaries between public and private tiers.
Can I diagram hybrid cloud with on-premises connections?
Yes. Describe your on-premises components and cloud components in the same prompt. The AI renders on-prem as a separate boundary with rack server and firewall icons, connected to cloud regions via labeled VPN or Direct Connect links. Bandwidth, latency annotations, and encryption labels appear on the interconnect.
How detailed should I specify networking in my prompt?
Include VPC CIDR ranges, subnet breakdowns for public and private tiers, and AZ assignments. The AI uses these to draw accurate network boundaries. Skip individual security group rules; those add clutter. Focus on subnet placement, peering connections, NAT gateways, and internet gateway routes for the clearest output.
Related diagram generators
Generate AWS architecture diagrams from text
Describe your AWS infrastructure in plain English. Get a valid Draw.io diagram with official AWS icons, VPC boundaries, and Multi-AZ placement.
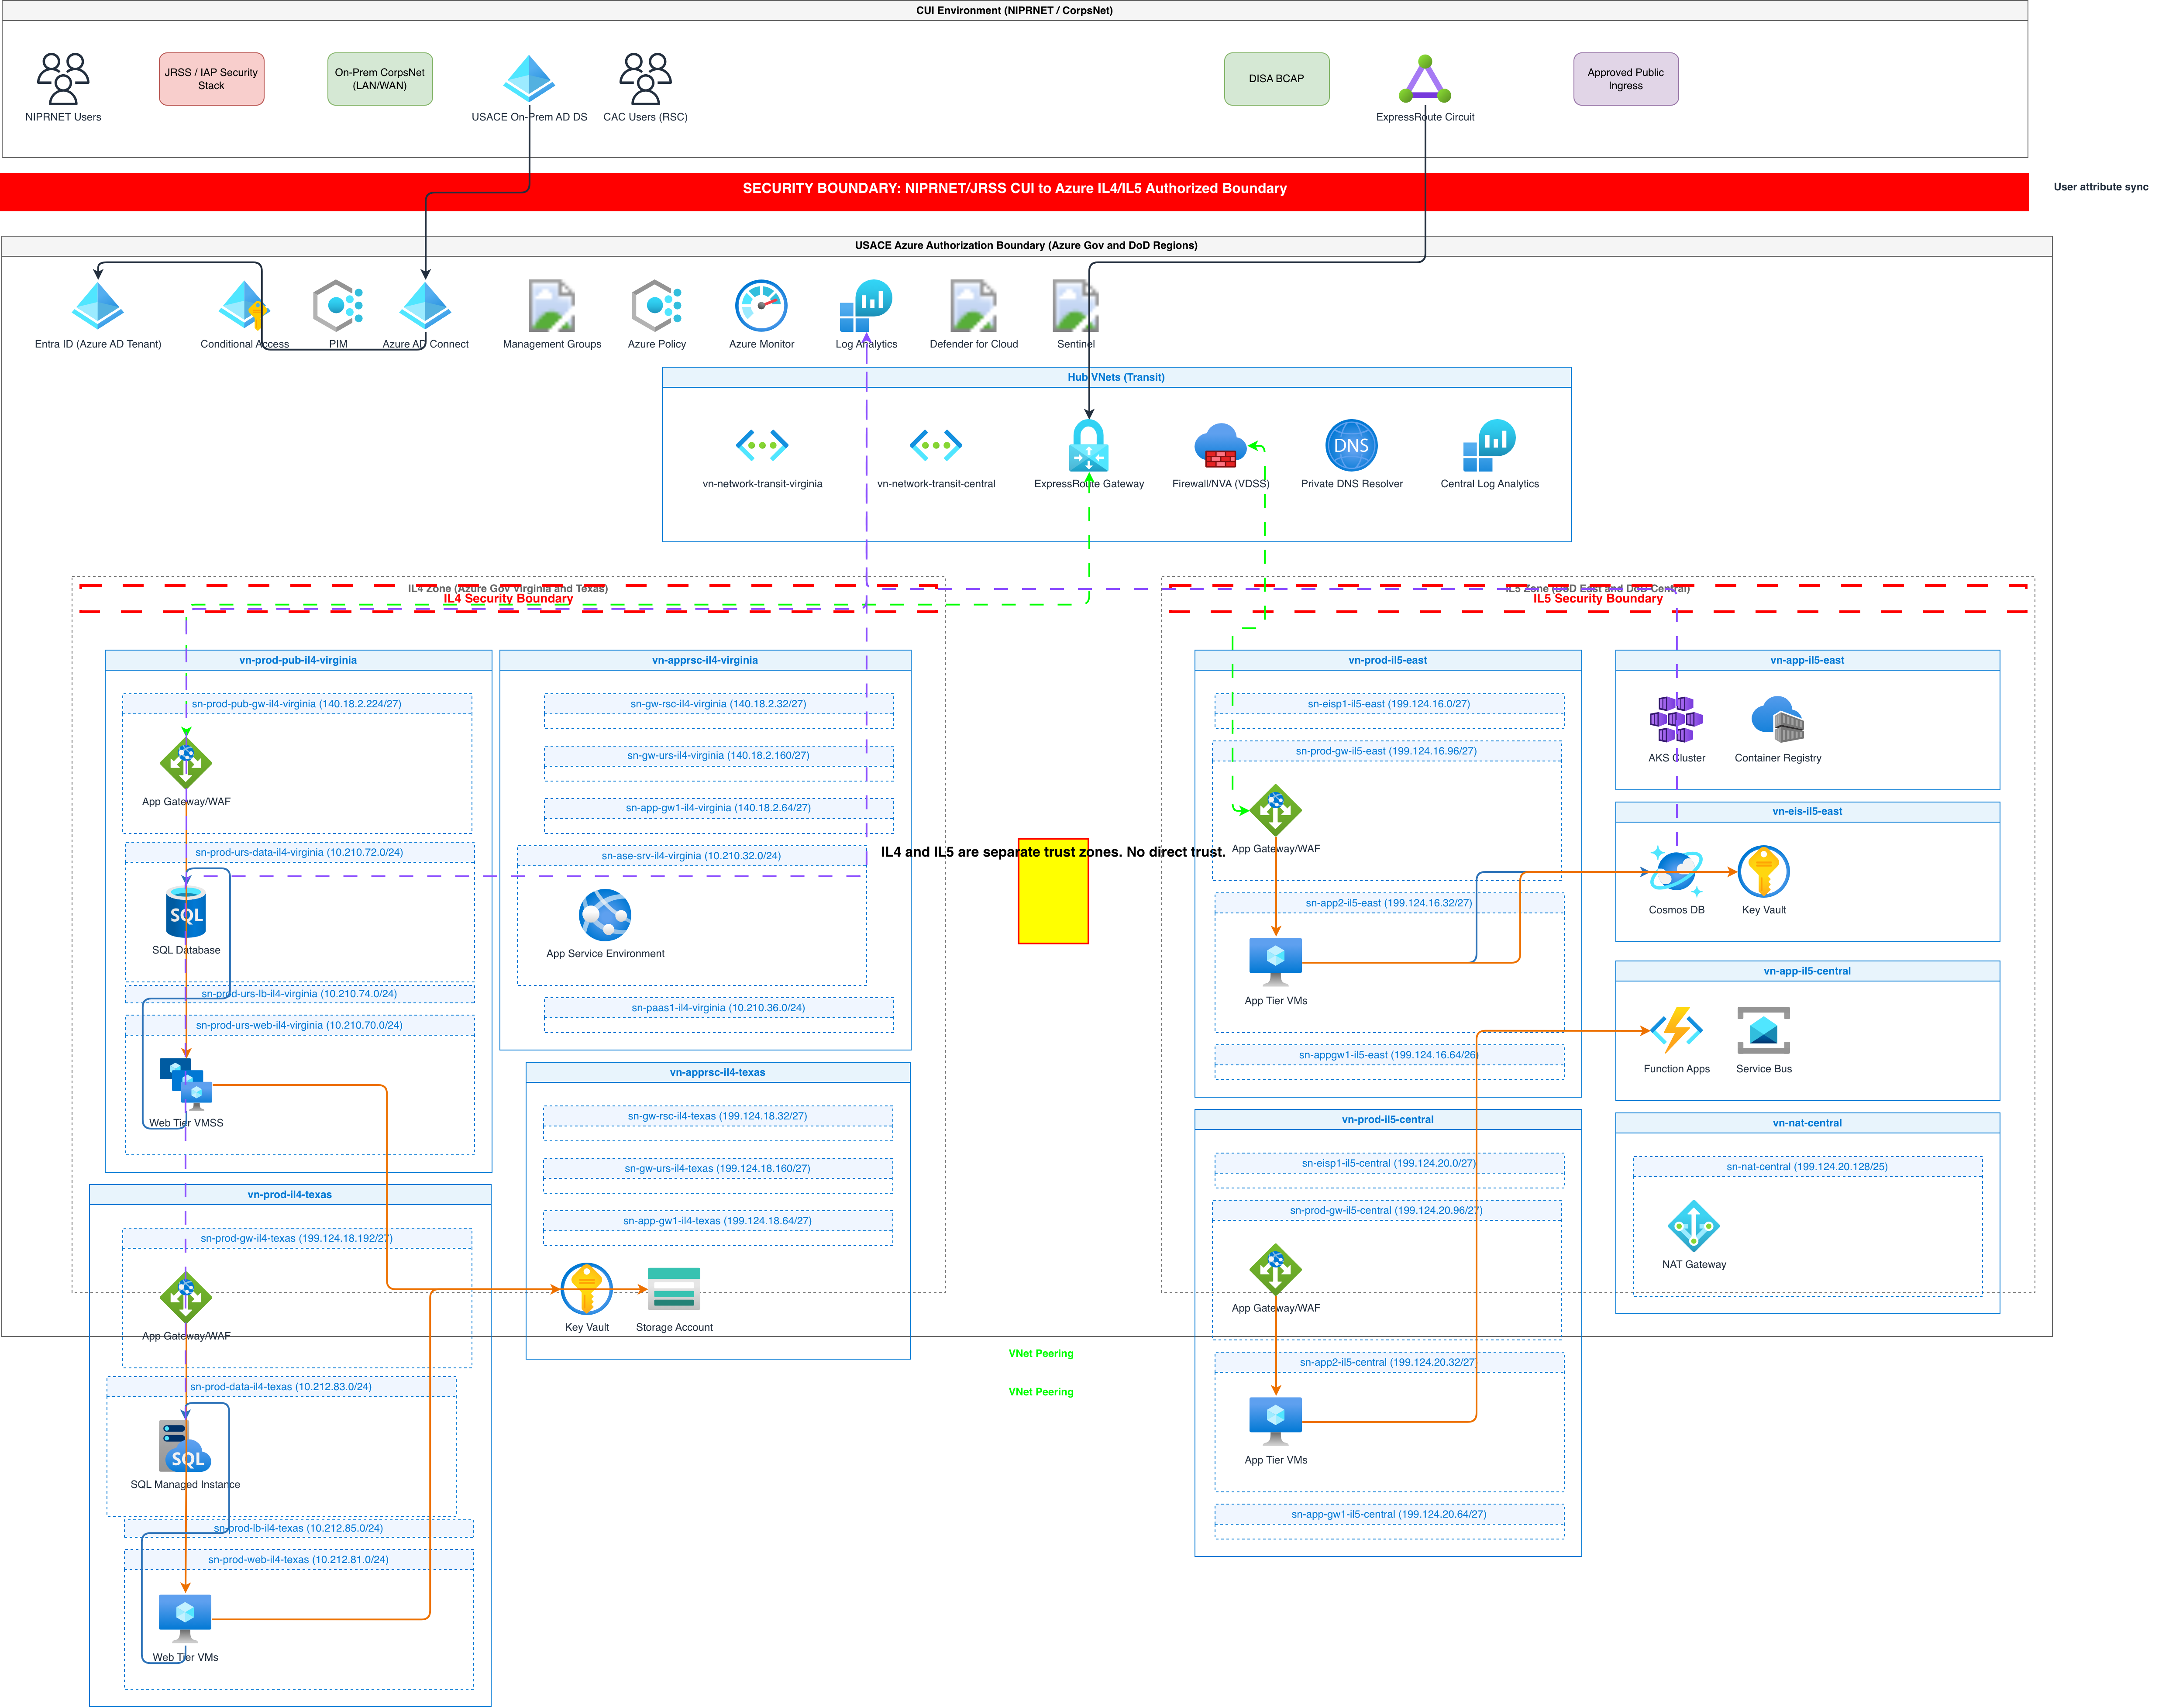
Generate Azure Architecture Diagrams from Text with AI
Describe your Azure infrastructure in plain English. Get a valid Draw.io diagram with official Azure icons, VNet boundaries, resource groups, and NSG rules.
Generate GCP Architecture Diagrams from Text
Describe your Google Cloud infrastructure in plain English. Get a valid Draw.io diagram with official GCP icons, project boundaries, and VPC networking.
Generate Kubernetes Diagrams from Text with AI
Describe your Kubernetes cluster in plain English. Get a valid Draw.io diagram with CNCF icons, namespace boundaries, deployments, services, and ingress controllers.