Generate Sequence Diagrams from Text with AI
Describe interactions between services or actors. Get a valid Draw.io sequence diagram with UML 2.5 lifelines, activation bars, and message arrows.
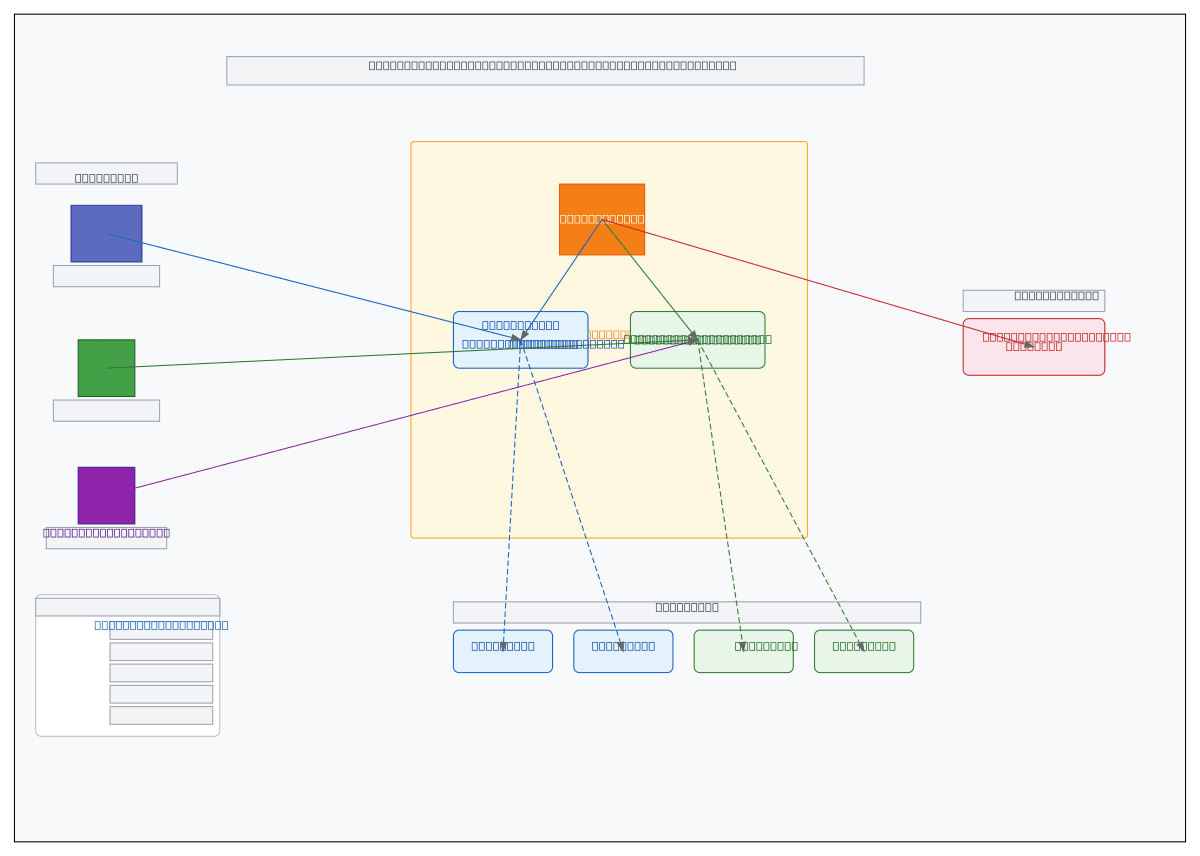
This AI sequence diagram generator converts plain-text interaction descriptions into Draw.io sequence diagrams with UML 2.5-compliant lifelines and message arrows. Describe an OAuth 2.0 authorization code flow between a browser, auth server, and resource API. The AI creates participant lifelines, draws synchronous request arrows and asynchronous callback arrows, adds activation bars showing processing time, and wraps conditional logic in alt fragments. Every element aligns to a 10px grid. Architecture warnings flag ambiguous components (WARN-05) that need clarification. VLM visual validation catches crossing message arrows and overlapping labels after render. The output is native .drawio XML that opens in Draw.io without conversion.
What Is an AI Sequence Diagram Generator?
A sequence diagram shows how objects or services interact over time. Vertical lifelines represent participants. Horizontal arrows represent messages sent between them, ordered from top to bottom. Activation bars on lifelines indicate when a participant is actively processing. Traditional diagramming tools require you to manually draw each lifeline, connect arrows in the right order, and position fragments by hand. An AI sequence diagram generator replaces that work. You describe the interaction in plain English. The AI identifies participants, determines message order, distinguishes synchronous calls (solid arrowhead) from asynchronous messages (open arrowhead), and adds return values as dashed arrows. Diagrams.so handles UML 2.5 combined fragments. When your description includes conditions like 'if the token is expired, refresh it,' the AI wraps those interactions in an alt fragment with guard conditions. Loop fragments appear when you describe retries or polling. Ref fragments link to sub-sequences for complex flows. The generator applies RULE-05 for consistent top-to-bottom temporal ordering. RULE-07 labels every arrow with the message name, parameters, and return type where specified. VLM visual validation detects messages that cross incorrectly or labels that overlap lifelines. Architecture warning WARN-05 flags participants with ambiguous names like 'Service' or 'Backend' that need specificity. The output is native .drawio XML compatible with Draw.io desktop, the VS Code extension, and Confluence. Export to PNG or SVG for embedding in API documentation or design specs.
Key components
- UML 2.5 lifelines with named participants (actors, services, databases, message queues)
- Synchronous messages (solid arrowhead) and asynchronous messages (open arrowhead) with labeled arrows
- Activation bars showing processing duration on each participant's lifeline
- Alt fragments with guard conditions for conditional paths like [token valid] / [token expired]
- Loop fragments for retry logic, polling intervals, and batch processing iterations
- Return messages as dashed arrows with response payloads (HTTP 200, JWT token, error codes)
- Self-calls shown as arrows looping back to the same lifeline for internal processing steps
- Destruction markers (X) on lifelines for participants that terminate mid-sequence
How to generate with AI
- 1
Describe the interaction flow
Write the sequence of messages between participants in plain English. Name each participant specifically: 'Browser,' 'Auth Server,' 'User Service,' 'PostgreSQL.' For example: 'Browser sends POST /oauth/authorize to Auth Server. Auth Server redirects to login page. User enters credentials. Auth Server validates against PostgreSQL. If valid, Auth Server issues authorization code and redirects to callback URL. Browser exchanges code for access token via POST /oauth/token.' Specify async calls and conditions explicitly.
- 2
Select diagram type and options
Choose 'Sequence' as the diagram type. Diagrams.so loads UML sequence diagram shapes from its 30+ icon libraries. Enable opinionated mode to enforce strict temporal ordering and automatic fragment wrapping for conditional logic. The AI follows RULE-07 to label every message with its name and parameters.
- 3
Generate and review
Click generate. The AI produces .drawio XML with lifelines, ordered messages, activation bars, and combined fragments. VLM visual validation flags crossing arrows and overlapping labels. Architecture warning WARN-05 identifies vaguely named participants. Download the .drawio file for editing, or export to PNG or SVG for API documentation. The file works in Draw.io desktop, VS Code, and Confluence.
Example prompt
OAuth 2.0 authorization code flow with PKCE. Participants: Browser, API Gateway (Kong), Auth Server (Keycloak), User Database (PostgreSQL), Resource API. Browser generates code_verifier and code_challenge. Browser sends GET /authorize with code_challenge to Auth Server via API Gateway. Auth Server returns login page. User submits credentials. Auth Server queries PostgreSQL to validate credentials. If valid, Auth Server generates authorization code and redirects to callback URL. Browser sends POST /token with authorization code and code_verifier to Auth Server. Auth Server validates code_verifier against stored code_challenge. If valid, Auth Server issues access_token (JWT, 15min TTL) and refresh_token (opaque, 7day TTL). Browser sends GET /api/resource with Bearer token to Resource API via API Gateway. API Gateway validates JWT signature. Resource API returns 200 with data. If token expired, Resource API returns 401. Browser sends POST /token with refresh_token. Auth Server issues new access_token.
Example diagrams from the gallery


Sequence Diagram vs Communication Diagram vs Timing Diagram
These three UML interaction diagrams model the same underlying behavior but emphasize different aspects. Sequence diagrams focus on message ordering over time. Communication diagrams emphasize the structural relationships between participants. Timing diagrams show state changes against a precise time axis.
| Feature | Sequence Diagram | Communication Diagram | Timing Diagram |
|---|---|---|---|
| Primary axis | Vertical time axis; messages flow top to bottom in chronological order | No explicit time axis; message order shown by sequence numbers (1, 1.1, 1.2) | Horizontal time axis with precise durations; state changes plotted over milliseconds or seconds |
| Participant layout | Horizontal row of lifelines; each participant gets a vertical dashed line | Free-form layout; participants placed to show structural connections like a network graph | Stacked horizontal rows; one row per participant with state levels shown as waveforms |
| Message representation | Horizontal arrows between lifelines; solid for sync, open for async, dashed for return | Lines between objects with numbered arrows; sequence numbers (1.1, 1.2) show call order | Transitions between states triggered by events; focus on when, not who sends |
| Conditional logic | Alt/opt fragments with guard conditions in square brackets like [amount > 500] | Guard conditions on individual numbered messages; no visual fragment boxes | Conditional branches not typically shown; focuses on timing of known paths |
| Best suited for | API call chains, OAuth flows, microservice request/response patterns, webhook sequences | Showing which objects collaborate during a use case; emphasizing link topology over order | Real-time systems, SLA validation, timeout analysis, hardware signal coordination |
When to use this pattern
Use a sequence diagram when message ordering between participants is the primary concern. API call chains, authentication flows, and microservice communication patterns are ideal candidates. If your flow involves more than six participants, consider splitting into sub-sequences using ref fragments to keep the diagram readable. Choose a communication diagram when the structural relationships between objects matter more than the exact message order. Choose a timing diagram when you need to show state durations, timeouts, or SLA thresholds against a precise time axis. Don't use sequence diagrams for data flow; they show control flow and message passing, not how data transforms between stores.
Frequently asked questions
What notation does the AI sequence diagram generator use?
This AI sequence diagram generator produces UML 2.5-compliant diagrams. Lifelines use the standard colon-name format (e.g., :AuthServer). Synchronous messages get solid arrowheads, asynchronous messages get open arrowheads, and return values use dashed lines. Combined fragments follow the UML spec for alt, loop, opt, and ref.
Can I show async messages and callbacks?
Yes. Describe the async call explicitly in your prompt, like 'API Gateway sends message to SQS queue asynchronously. Worker polls queue and processes message.' The AI uses open arrowheads for async messages and solid arrowheads for synchronous calls. Callbacks appear as separate return messages to the original caller.
How are conditional branches represented?
The AI wraps conditional logic in UML combined fragments. An 'if/else' in your prompt becomes an alt fragment with guard conditions like [credentials valid] and [credentials invalid]. Single conditions use opt fragments. The guard text appears in the top-left corner of the fragment box, matching UML 2.5 conventions.
Is there a limit on the number of participants?
The 5,000-character prompt limit is the practical constraint, not a participant count. That said, diagrams with more than eight lifelines get visually dense. For complex flows, break the interaction into sub-sequences and use ref fragments to link them. Diagrams.so generates each sub-sequence as a separate .drawio file.
Can I generate sequence diagrams for microservice architectures?
Yes. Name each microservice as a participant: 'Order Service,' 'Inventory Service,' 'Payment Service,' 'Notification Service.' Describe the message chain with specific endpoints like POST /orders, GET /inventory/check, and POST /payments/charge. The AI draws the full call chain with activation bars showing which service is processing at each step.
Related diagram generators
Generate Flowcharts from Text with AI
Describe a process in plain English. Get a valid Draw.io flowchart with correct ISO 5807 symbols, decision diamonds, and directional arrows.
Generate UML Diagrams from Text with AI
Describe your classes, components, or deployment topology in plain English. Get a valid Draw.io UML diagram with correct UML 2.5 notation and relationships.
Generate API Gateway Diagrams from Text with AI
Describe your API gateway routing, auth, and rate limiting in plain English. Get a valid Draw.io diagram with request flows, middleware chains, and backend services.
Generate Microservices Architecture Diagrams from Text
Describe your service boundaries in plain English. Get a valid Draw.io diagram with API gateways, message brokers, database-per-service patterns, and service mesh routing.