Generate CI/CD Pipeline Diagrams from Text with AI
Describe your build, test, and deploy stages in plain English. Get a valid Draw.io pipeline diagram with parallel jobs, approval gates, and rollback paths.
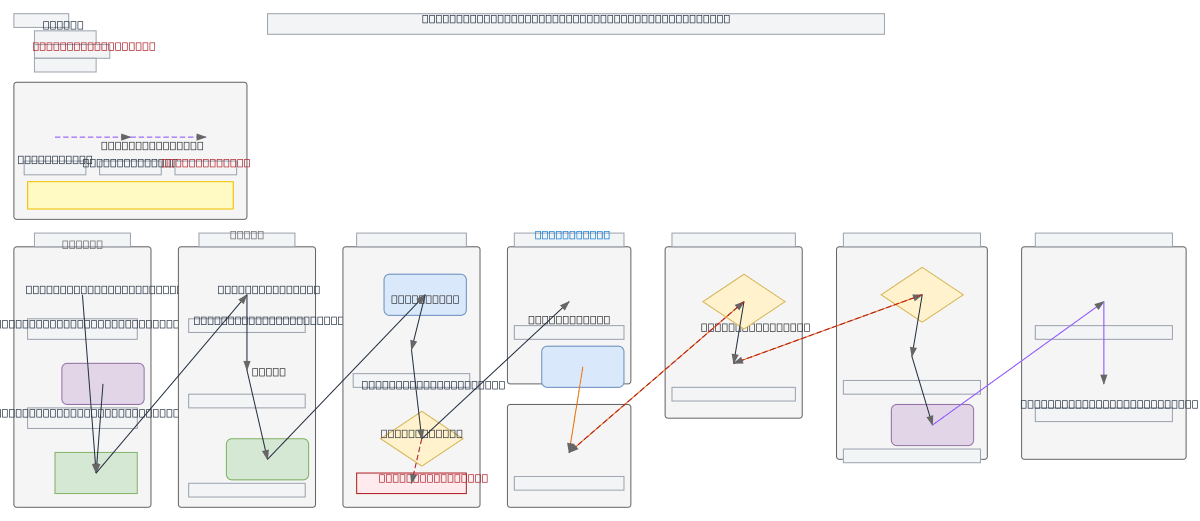
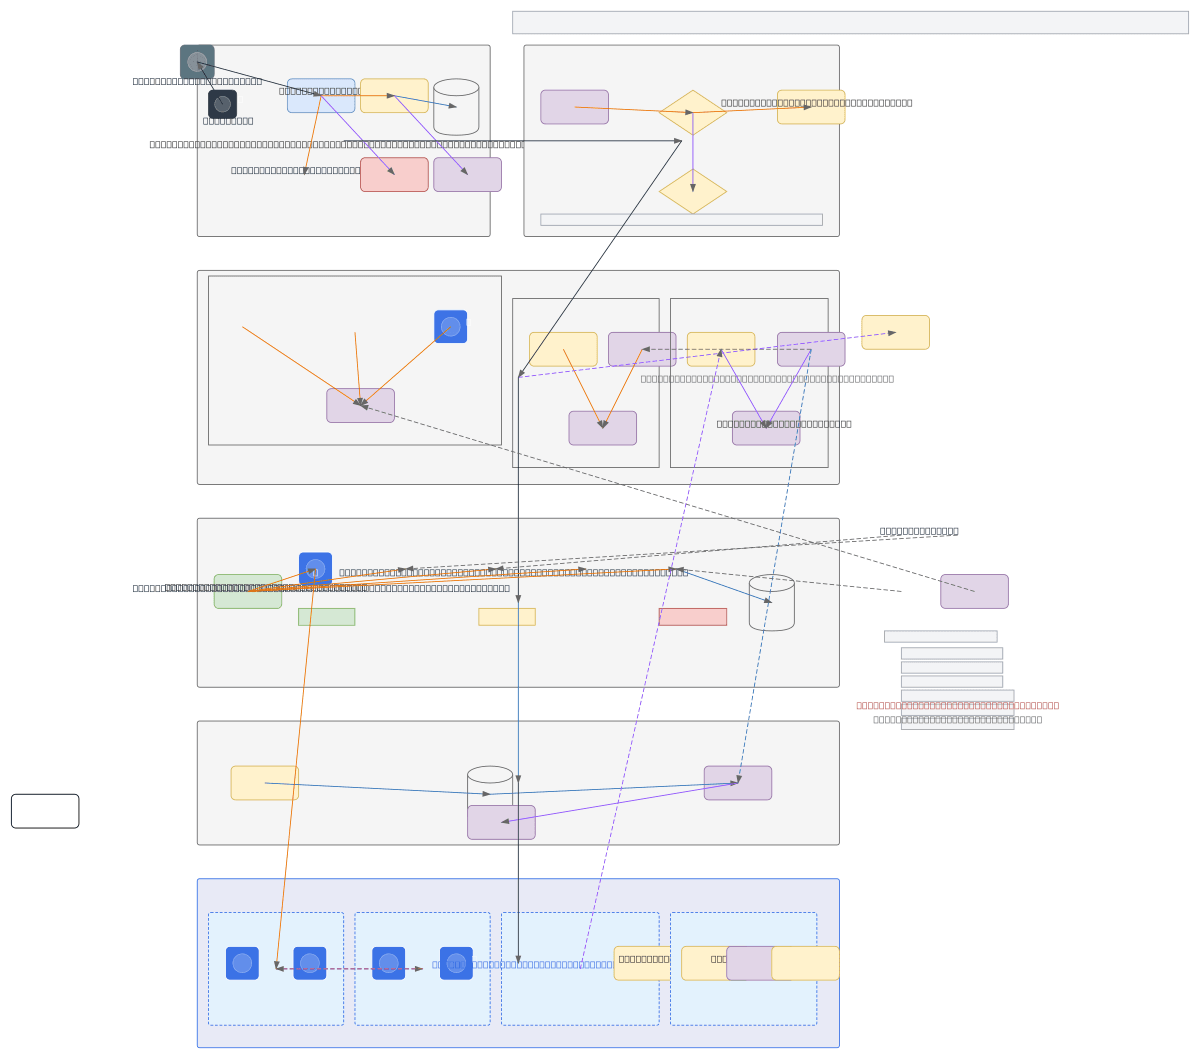
This AI CI/CD pipeline diagram generator converts plain-text deployment workflows into Draw.io pipeline diagrams with stages, parallel jobs, and approval gates. Describe a GitHub Actions workflow that builds a Docker image, pushes to Amazon ECR, deploys to an EKS staging cluster via ArgoCD, runs Cypress end-to-end tests, then promotes to production with a manual approval gate. The AI maps each stage to a labeled node, wires parallel jobs with fork/join connectors, and marks rollback paths with distinct arrow styles. Every node snaps to a 10px grid per RULE-04. Architecture warnings flag public endpoints missing a WAF (WARN-02) and single-AZ deployments in your target clusters (WARN-01). The output is native .drawio XML that opens in Draw.io, Confluence, or VS Code.
What Is an AI CI/CD Pipeline Diagram Generator?
A CI/CD pipeline diagram maps the automated stages between a code commit and a production deployment. Traditional diagramming means dragging rectangles into a canvas, manually connecting build, test, and deploy stages, and redrawing everything when someone adds a new environment. An AI CI/CD pipeline diagram generator replaces that labor. You write your pipeline in plain English. The AI parses stages, identifies parallel execution blocks, and outputs a structured Draw.io diagram. Diagrams.so understands CI/CD-specific constructs. Mention 'GitHub Actions matrix strategy testing Node 18 and Node 20' and you get parallel job lanes. Mention 'ArgoCD ApplicationSet with wave-based sync' and the diagram shows ordered sync waves with dependency arrows. Describe 'blue-green deployment to EKS with ALB target group switching' and the output includes both active and standby clusters with a weighted routing node. The AI enforces left-to-right layout (RULE-05) so the pipeline reads chronologically from source to production. Opinionated mode prevents layout overrides that would break stage ordering. VLM visual validation catches overlapping stage labels and crossing connectors after generation. Architecture warnings cover critical gaps: WARN-01 flags single-AZ target clusters, WARN-02 catches production endpoints without WAF protection, WARN-03 identifies databases in the deploy target without replicas. The output is native .drawio XML with icons from 30+ libraries including AWS, GCP, and Kubernetes sets. Export to PNG, SVG, or commit the XML directly to your repository alongside the pipeline definition itself.
Key components
- Pipeline stages as sequential nodes: source, build, test, deploy, verify, promote
- Parallel job lanes for matrix strategies (multi-version, multi-platform builds)
- Manual approval gates with reviewer labels and timeout annotations
- Rollback paths as dashed arrows linking production back to previous stable release
- Environment-specific columns: dev, staging, UAT, production with color-coded headers
- ArgoCD sync wave ordering with numbered dependency edges
- Artifact flow arrows showing Docker image tags from ECR/GCR/ACR to deploy targets
- Failure notification branches to Slack channels, PagerDuty, or email endpoints
How to generate with AI
- 1
Describe your pipeline stages
Write the pipeline in plain English. Be explicit about stage ordering, parallel jobs, and conditions. For example: 'On push to main, GitHub Actions runs lint and unit tests in parallel. If both pass, build Docker image tagged with commit SHA and push to ECR. Deploy to staging EKS cluster using ArgoCD. Run Playwright integration tests against staging. On success, wait for manual approval from the platform-eng team. On approval, deploy to production EKS with canary rollout at 10%, 50%, 100%. If canary health checks fail, roll back to previous ArgoCD revision.'
- 2
Select diagram type and cloud provider
Choose 'DevOps' as the diagram type. Select your cloud provider (AWS, GCP, or Azure) to load the matching icon library. The AI uses native ECR, EKS, Cloud Build, GKE, ACR, and AKS icons instead of generic boxes. Diagrams.so pulls from 30+ icon libraries. Enable opinionated mode to enforce strict left-to-right chronological layout and prevent manual reordering of stages.
- 3
Generate and validate
Click generate. The AI outputs a .drawio XML file with grid-aligned stages, parallel job lanes, and labeled connectors. VLM visual validation flags overlapping stage names or tangled arrows between environments. Architecture warnings identify risks in your target infrastructure: single-AZ clusters (WARN-01), exposed endpoints (WARN-02), unreplicated databases (WARN-03). Download as .drawio for editing, or export to PNG or SVG for documentation.
Example prompt
CI/CD pipeline for a Node.js monorepo: developer opens PR, GitHub Actions triggers lint (ESLint), unit tests (Vitest), and security scan (Trivy) in parallel. On merge to main, build Docker images for api-service and web-service, tag with git SHA, push to AWS ECR. ArgoCD detects new image tags and syncs to staging EKS cluster in us-east-1. Run Cypress E2E tests against staging ALB endpoint. If E2E passes, create Jira deployment ticket and wait for manual approval from release-managers group with 24-hour timeout. On approval, ArgoCD promotes to production EKS cluster using canary strategy: 10% traffic for 5 minutes, 50% for 10 minutes, then 100%. If any canary health check fails, ArgoCD auto-reverts to last synced revision and sends PagerDuty alert to on-call team. Include rollback path from production to previous stable ECR image tag.
Example diagrams from the gallery


CI/CD Pipeline Diagram vs Deployment Architecture Diagram vs GitOps Flow Diagram
These three diagram types address different aspects of software delivery. CI/CD pipeline diagrams focus on the temporal sequence of build and deploy stages. Deployment architecture diagrams show the runtime topology of deployed services. GitOps flow diagrams emphasize the declarative reconciliation loop between Git state and cluster state.
| Feature | CI/CD Pipeline Diagram | Deployment Architecture Diagram | GitOps Flow Diagram |
|---|---|---|---|
| Primary purpose | Map the ordered stages from code commit to production deployment with gates and conditions | Show the runtime layout of services, load balancers, databases, and networking in target environments | Illustrate the reconciliation loop where ArgoCD or Flux syncs declared Git manifests to cluster state |
| Time representation | Explicitly left-to-right chronological; each stage executes after its predecessor completes or in parallel | No time axis; shows a static snapshot of what's running and how components connect | Cyclical; shows continuous reconciliation between desired state in Git and actual state in cluster |
| Key elements | Stages, parallel jobs, approval gates, artifact registries (ECR, GCR), rollback arrows | Services, pods, load balancers, VPCs, subnets, databases, DNS entries | Git repository, CI trigger, image registry, ArgoCD/Flux controller, Kubernetes cluster, drift detection |
| Failure handling | Explicit failure branches with notification sinks (Slack, PagerDuty) and rollback paths | Failover paths between primary and standby instances, multi-AZ redundancy indicators | Drift alerts when cluster state diverges from Git; auto-remediation arrows back to desired state |
| Audience | Platform engineers, DevOps teams, release managers reviewing deployment workflows | Infrastructure teams, architects, compliance auditors reviewing runtime topology | SRE teams, GitOps practitioners evaluating reconciliation and drift management |
| Best suited for | Sprint demo walkthroughs, incident post-mortems tracing which stage failed, onboarding new engineers | AWS Well-Architected reviews, SOC 2 audit documentation, capacity planning discussions | Evaluating ArgoCD ApplicationSet topologies, multi-cluster promotion strategies, policy enforcement points |
When to use this pattern
Use a CI/CD pipeline diagram when you need to document the sequence of automated stages between a code commit and production deployment. Common scenarios include onboarding new engineers to the release process, preparing incident post-mortems that trace which stage introduced a regression, and creating compliance documentation for SOC 2 audits that require evidence of deployment controls. If your focus is on the runtime topology of deployed services rather than the build sequence, use a deployment architecture diagram instead. If you're documenting the GitOps reconciliation loop with ArgoCD or Flux, a GitOps flow diagram captures the continuous sync cycle better than a linear pipeline. Keep pipeline diagrams under 15 stages for readability.
Frequently asked questions
What CI/CD tools does the AI CI/CD pipeline diagram generator support?
This AI CI/CD pipeline diagram generator supports GitHub Actions, GitLab CI, Jenkins, CircleCI, ArgoCD, Flux, AWS CodePipeline, Google Cloud Build, and Azure DevOps Pipelines. Mention the tool by name in your prompt and the AI selects the matching icon from the 30+ available libraries. Custom tools render as labeled generic nodes.
Can I show parallel jobs in the pipeline diagram?
Yes. Describe parallel stages explicitly, like 'run lint, unit tests, and security scan in parallel.' The AI creates a fork node before the parallel jobs and a join node after, matching how GitHub Actions matrix strategies and GitLab CI parallel keyword actually execute. Each job gets its own lane.
How are rollback paths represented?
Rollback paths render as dashed arrows from the production stage back to a previous stable state, typically an earlier ECR image tag or ArgoCD revision. The AI labels the arrow with the rollback trigger condition, like 'health check failure within 10 minutes.' This distinguishes rollback flows from normal forward progression.
Does the diagram include approval gates?
Yes. Mention a manual approval step in your prompt and the AI inserts a gate node with the reviewer group label and optional timeout. For example, 'wait for release-managers approval with 24-hour timeout' produces a gate node between staging verification and production deploy, with timeout annotation.
Can I generate multi-environment pipeline diagrams?
Yes. Describe each target environment (dev, staging, UAT, production) and the AI creates environment-specific columns with color-coded headers. Promotion arrows between environments show the conditions required to advance, such as passing E2E tests or obtaining manual approval. Each environment links to its specific cluster or service.
Related diagram generators
Generate Kubernetes Diagrams from Text with AI
Describe your Kubernetes cluster in plain English. Get a valid Draw.io diagram with CNCF icons, namespace boundaries, deployments, services, and ingress controllers.
Generate AWS architecture diagrams from text
Describe your AWS infrastructure in plain English. Get a valid Draw.io diagram with official AWS icons, VPC boundaries, and Multi-AZ placement.
Generate DevOps Diagrams from Text with AI
Describe your DevOps toolchain in plain English. Get a valid Draw.io diagram with correct tool icons, pipeline flows, and infrastructure relationships.
Generate Flowcharts from Text with AI
Describe a process in plain English. Get a valid Draw.io flowchart with correct ISO 5807 symbols, decision diamonds, and directional arrows.