What Is a Flowchart?
A flowchart maps the steps of a process using standardized symbols for decisions, actions, and flow direction. This guide covers the notation, types, and practices that make flowcharts effective communication tools.
Definition, origin, and the ISO 5807 standard
A flowchart is a diagram that represents a process as a sequence of steps, decision points, and directional flow arrows. What is a flowchart beyond that basic definition? It's one of the oldest formalized diagramming methods in computing, with roots predating electronic computers. Frank Gilbreth presented the first structured process flow diagrams to the American Society of Mechanical Engineers in 1921, using them to document manufacturing workflows. Herman Goldstine and John von Neumann adapted the concept for computer programming in the 1940s, creating flow diagrams to plan programs for the ENIAC. ISO 5807, published in 1985, standardized the symbols that most engineers recognize today. The standard defines specific shapes for specific purposes. Rounded rectangles (terminators) mark the start and end of a process. Regular rectangles represent process steps or actions. Diamonds represent decision points with yes/no or true/false branches. Parallelograms represent input/output operations: reading user input, displaying results, or writing to a file. Arrows connect shapes and indicate flow direction. The standard also defines a predefined process symbol (rectangle with vertical bars on each side) for subroutines or reusable process blocks. Flowcharts succeeded because they solve a real communication problem: describing sequential logic visually is faster than describing it in prose. A 15-step approval process with three decision branches takes two paragraphs of dense text to describe. The same process takes a single flowchart that a reader can trace in 30 seconds. The visual format makes branching logic, loops, and parallel paths immediately apparent in a way that bullet-point lists cannot.
Standard symbols and what each one means
The terminator (rounded rectangle or stadium shape) appears exactly twice in a well-formed flowchart: once at the start and once at the end. Label the start terminator with the trigger event: 'User clicks Submit,' 'Cron job fires at 00:00 UTC,' or 'Webhook received.' Label the end terminator with the outcome: 'Order confirmed,' 'Error logged,' or 'Report emailed.' Using descriptive labels instead of generic 'Start' and 'End' immediately tells the reader the scope of the process. The process rectangle is the workhorse symbol. Each rectangle contains one action: 'Validate input fields,' 'Calculate shipping cost,' 'Insert row into orders table.' Keep actions atomic. A rectangle labeled 'Process the order' is too vague. Break it into 'Validate inventory,' 'Calculate total,' 'Charge payment method,' and 'Create shipment.' The decision diamond poses a question with two or more exit paths. Label the diamond with a yes/no question or a condition: 'Payment authorized?' or 'Retry count < 3?' Label each exit arrow with the corresponding answer. Always handle both branches. An unlabeled exit from a diamond is a bug in the flowchart, just as an unhandled case is a bug in code. The input/output parallelogram represents data entering or leaving the process: 'Read config file,' 'Display error message,' 'Send email notification.' Distinguish between inputs the process receives and outputs it produces. The predefined process symbol (rectangle with double vertical borders) represents a subprocess defined elsewhere. Use it when a step is complex enough to warrant its own flowchart. Label it with the subprocess name and maintain a separate flowchart for that subprocess. This keeps individual flowcharts manageable. Arrows must have a single direction. An arrow splitting into two paths (without a decision diamond) is invalid. Every split must be preceded by a decision. Every merge should rejoin at a single point before continuing.
Flowchart types: basic, swim lane, cross-functional, and hierarchical
A basic flowchart is a linear sequence of steps with decision branches. It works for single-actor processes: a user signing up for an account, a script processing a CSV file, or an incident response procedure. One actor, one path through the system. Keep it simple. If your basic flowchart requires horizontal scrolling, it's trying to do too much. Swim lane flowcharts (also called cross-functional flowcharts) add horizontal or vertical lanes that represent different actors, departments, or systems. Each lane is labeled: 'Customer,' 'Sales Team,' 'Billing System,' 'Warehouse.' Steps are placed in the lane of the actor responsible for performing them. Arrows crossing lane boundaries show handoffs between actors. This format is essential for processes that span organizational boundaries. GitHub's issue triage process, for example, involves the reporter (creating the issue), the bot (adding labels), the team lead (assigning priority), and the developer (investigating). A swim lane flowchart makes each handoff visible. Cross-functional flowcharts are swim lane charts with a time dimension. The horizontal axis represents departments, and the vertical axis represents time phases (or vice versa). This adds a temporal element that swim lane charts lack. Use cross-functional flowcharts for processes with strict phase gates, like a software release process with development, code review, QA, staging, and production phases. Hierarchical flowcharts organize complex processes into levels of detail. The top level shows major phases as predefined process symbols. Each one links to a detailed flowchart at the next level. This is the flowchart equivalent of Simon Brown's C4 model: start at the highest abstraction level and drill down only where detail is needed. A deployment pipeline might have a top-level chart with 'Build,' 'Test,' 'Deploy Staging,' 'Approve,' and 'Deploy Production.' Each of those boxes expands into its own detailed flowchart.
When to use a flowchart and when to pick a different diagram
Use a flowchart when your process has a clear start, a clear end, and sequential steps with decision branches in between. Onboarding checklists, troubleshooting guides, approval workflows, and feature flag evaluation logic are all good candidates. If you can describe the process as 'first do X, then if Y do Z, otherwise do W,' a flowchart is the right tool. Don't use a flowchart for event-driven systems where multiple events trigger independent reactions with no fixed sequence. A Kafka consumer processing events from three different topics concurrently doesn't fit a flowchart's sequential model. Use an event storming diagram or a sequence diagram instead. Don't use a flowchart when the primary concern is data movement rather than control flow. If you need to show that user clickstream data flows from a web app through Kinesis into S3, gets transformed by a Glue job, and lands in Redshift for analytics, use a data flow diagram. The emphasis is on what data goes where, not the decision logic at each step. Don't use a flowchart for showing which component sends messages to which other component over time. That's a sequence diagram. The key distinction: flowcharts show the logic of one process. Sequence diagrams show the interaction between multiple participants. If your diagram has named participants on the horizontal axis and time on the vertical axis, you want a sequence diagram, not a flowchart. State machine diagrams are better when the process is defined by states and transitions rather than sequential steps. A subscription lifecycle (trial, active, past_due, canceled, expired) is a state machine. Each state has defined transitions triggered by events (payment_succeeded, payment_failed, user_canceled). A flowchart can represent this, but a state diagram communicates the model more naturally.
Best practices: step count, labeling, and layout direction
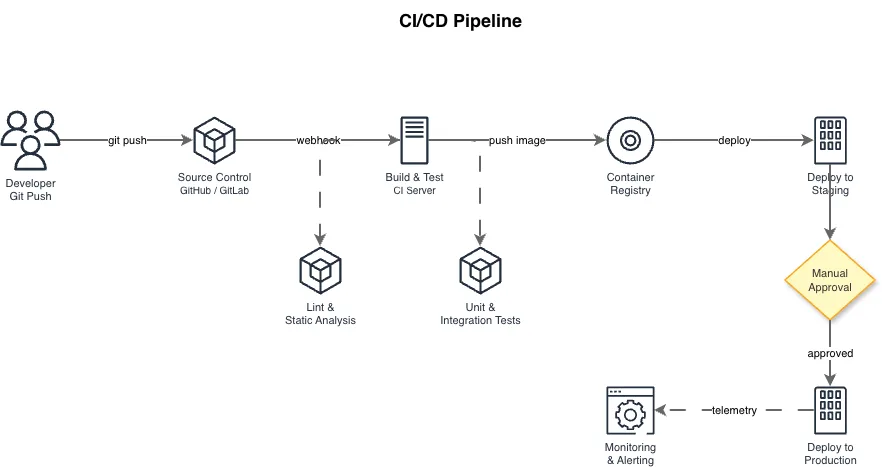
Keep individual flowcharts under 20 steps. Research on diagram comprehension shows that beyond 20 nodes, readers lose track of the overall flow and start tracing individual paths rather than understanding the complete process. If your flowchart exceeds 20 steps, look for natural breakpoints where you can extract a predefined process symbol linked to a sub-flowchart. A CI/CD pipeline with build, unit test, integration test, security scan, staging deploy, smoke test, approval, production deploy, and rollback steps is already 9 steps. Add error handling branches and you're at 15-20. That's one flowchart, not two. Label every decision exit explicitly. 'Yes' and 'No' are acceptable for binary decisions. For multi-way branches (rare in flowcharts, common in code), label each exit with the specific condition: 'HTTP 200,' 'HTTP 4xx,' 'HTTP 5xx,' 'Timeout.' Unlabeled arrows leaving a decision diamond are ambiguous and will be interpreted differently by every reader. Use left-to-right or top-to-bottom layout consistently. Don't mix directions within a single flowchart. Left-to-right is natural for Western readers and fits widescreen monitors. Top-to-bottom works better for long sequential processes and fits printed documents. Pick one per flowchart. Avoid crossing arrows. If two flow lines must cross, restructure the layout. Crossing arrows create ambiguity about which path continues where. In rare cases where crossings are unavoidable, use a small bridge (arc) symbol where one line passes over another, or use connectors (small labeled circles) to jump between separate areas of the chart. Color-code for emphasis, not for meaning. Highlighting the error path in red and the happy path in green is useful. Encoding decision logic in colors (blue means approval, yellow means review) forces readers to memorize a legend and fails in black-and-white printing.
Creating flowcharts with AI instead of manual layout
Drag-and-drop flowchart tools require you to place each symbol, draw each arrow, and manually align the layout. For a 15-step process with 3 decision branches, that's typically 10 to 15 minutes of clicking and dragging before the chart communicates anything. The bottleneck isn't design thinking. It's mechanical layout work. AI flowchart generation eliminates the layout step. You describe the process in natural language: 'User submits login form. Validate email format. If invalid, show error and return to form. Query database for user record. If not found, show error. Compare password hash. If mismatch, increment failure counter. If failure counter exceeds 5, lock account and notify admin. Otherwise, generate JWT and redirect to dashboard.' The AI parses the steps, identifies decision points, selects the correct ISO 5807 symbols, and produces a properly laid out flowchart. The generated output preserves the semantics of your description. Decision diamonds get labeled with the conditions you specified. Process rectangles contain the actions you described. The layout follows left-to-right or top-to-bottom conventions with no crossing arrows. Grid alignment ensures every shape is positioned cleanly without manual nudging. The key advantage over manual tools isn't just speed. It's consistency. Every flowchart generated from text follows the same layout rules, the same symbol sizing, and the same spacing conventions. Manual flowcharts drift in style across teams and over time. Diagrams.so generates flowcharts from plain-text descriptions and outputs native .drawio XML files. Describe your process, including decision conditions and error paths, and get a grid-aligned flowchart with proper ISO 5807 symbols. The .drawio file opens in Draw.io desktop, VS Code, Confluence, or any mxGraph-compatible editor for further editing.
Real-world examples


Generate these diagrams with AI
Generate Flowcharts from Text with AI
Describe a process in plain English. Get a valid Draw.io flowchart with correct ISO 5807 symbols, decision diamonds, and directional arrows.
Online Flowchart Maker Powered by AI
Describe your process. Get a flowchart with correct decision diamonds, swim lanes, and directional arrows. No desktop software. No manual shape dragging.
Generate Data Flow Diagrams from Text with AI
Describe how data moves through your system. Get a valid Draw.io DFD with Yourdon-DeMarco notation, decomposition levels, and named data flows.