Generate Oracle Database Architecture Diagrams from Text with AI
Describe your Oracle Database topology in plain English. Get a valid Draw.io diagram with RAC nodes, Data Guard standby, PDB/CDB containers, and replication flows.
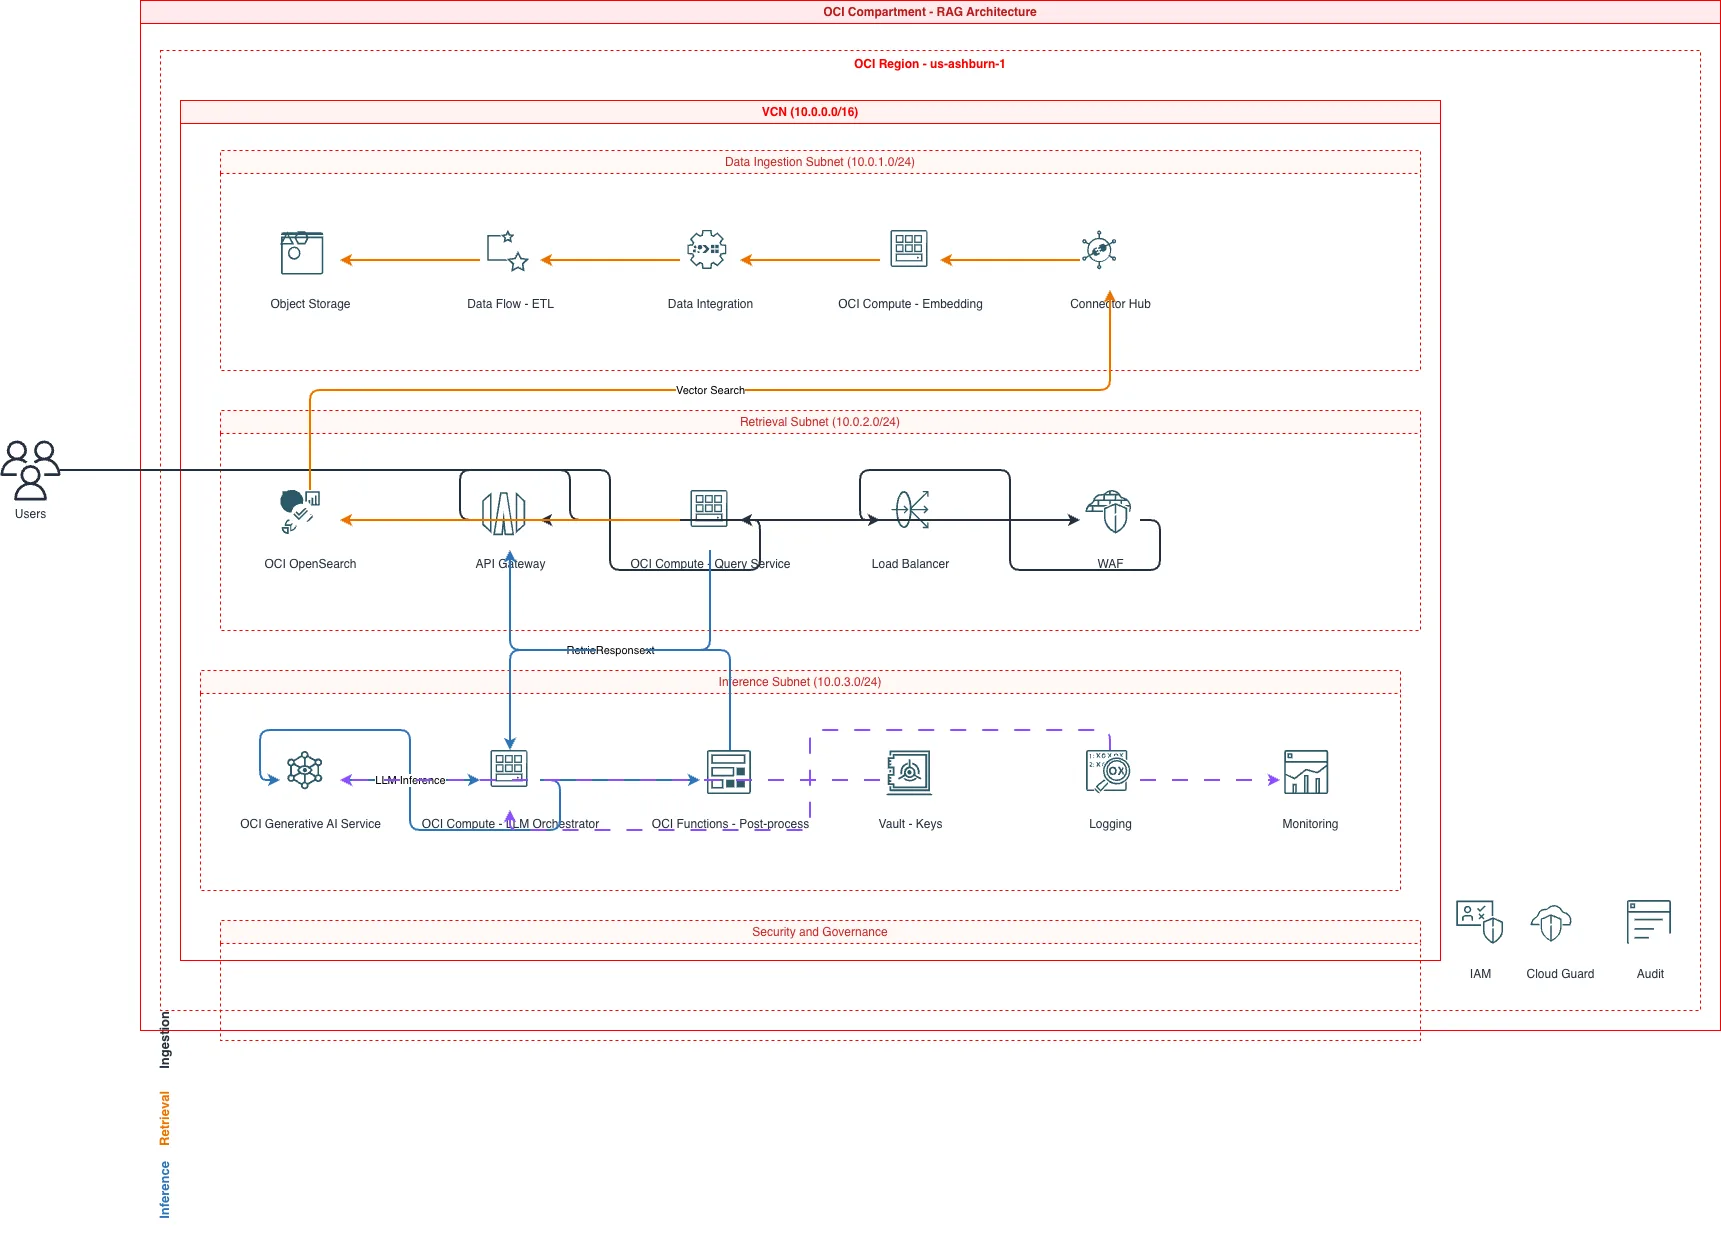
This Oracle Database architecture diagram generator converts plain-text database topology descriptions into Draw.io diagrams with Oracle-specific icons and layout conventions. Describe a setup like a two-node Oracle RAC cluster on Exadata X10M with ASM disk groups, a physical standby via Data Guard in a remote region, and GoldenGate bidirectional replication to an Autonomous Data Warehouse for analytics. The AI maps each component to its correct icon, draws redo transport arrows between primary and standby, labels PDB/CDB relationships, and outputs valid mxGraphModel XML. Architecture warnings flag databases without replicas (WARN-03) and missing security boundaries between production and reporting tiers (WARN-04). Grid alignment follows RULE-04. The output opens directly in Draw.io.
What Is an Oracle Database Architecture Diagram Generator?
An Oracle Database architecture diagram maps the physical and logical topology of your database estate: RAC instances sharing storage, Data Guard standbys receiving redo, GoldenGate streams replicating between sites, and Autonomous Database services on shared Exadata infrastructure. Drawing these by hand requires knowing which components sit on which nodes, how redo transport works, and where ASM disk groups connect. An Oracle Database architecture diagram generator handles this from a text prompt. You describe something like: 'Production CDB with three PDBs running on a 2-node RAC cluster. ASM disk groups +DATA and +RECO on shared storage. Physical standby via Data Guard with maximum availability protection mode. GoldenGate 21c extract on primary feeding a replicate process on Autonomous Transaction Processing for real-time reporting.' Diagrams.so parses this and produces a diagram with correct Oracle icons from its icon library. RAC nodes render as grouped instances sharing ASM storage. Data Guard arrows show redo transport direction with sync/async labels. PDB containers appear nested inside CDB boundaries. GoldenGate trails display as labeled replication streams between source and target. The AI follows RULE-06 to group related components: RAC instances with their shared storage, a CDB with its PDBs. WARN-03 fires when a database lacks any standby or replica. WARN-04 triggers when production and reporting databases share network segments without a security boundary. VLM visual validation catches overlapping node labels in dense RAC topologies. The .drawio output lets you version-control your database architecture alongside application diagrams.
Key components
- RAC cluster nodes shown as grouped compute icons with shared ASM disk group connections (+DATA, +RECO)
- CDB/PDB container hierarchy with PDBs nested inside CDB boundaries and service name labels
- Data Guard redo transport arrows with protection mode annotations (max availability, max performance)
- GoldenGate replication streams with extract, trail, and replicate process labels and latency annotations
- Exadata infrastructure icons distinguishing compute nodes, storage cells, and InfiniBand fabric
- Oracle REST Data Services (ORDS) shown as API gateway icons connecting applications to database endpoints
- Autonomous Database icons distinguishing ATP (OLTP workloads) from ADW (analytics workloads) with wallet connections
- Architecture warnings for no replica (WARN-03), missing security boundaries (WARN-04), and ambiguous components (WARN-05)
How to generate with AI
- 1
Describe your Oracle Database topology
Write your database architecture in plain English. Be specific about node counts, storage, replication, and connectivity. For example: 'Two-node RAC on Exadata X10M in us-ashburn-1 AD-1. CDB named PRODCDB with PDBs: APP_PDB, REPORT_PDB, and AUDIT_PDB. ASM disk groups +DATA (high redundancy) and +RECO (normal redundancy). Physical standby in us-phoenix-1 via Data Guard max availability mode. GoldenGate 21c replicating APP_PDB changes to Autonomous Data Warehouse for analytics dashboards.'
- 2
Select diagram type and cloud provider
Choose 'Architecture' as the diagram type and 'OCI' as the cloud provider for cloud-hosted Oracle databases. Diagrams.so loads Oracle-specific icons including RAC, Exadata, Data Guard, GoldenGate, and Autonomous Database shapes from its 30+ icon libraries. Enable opinionated mode for strict left-to-right layout showing primary on the left and standby or replicas on the right.
- 3
Generate and validate
Click generate. The AI produces .drawio XML with RAC node groupings, Data Guard redo arrows, PDB/CDB nesting, and GoldenGate stream labels. Architecture warnings flag databases without standby (WARN-03) and production/reporting tiers sharing network segments without security boundaries (WARN-04). VLM visual validation catches overlapping labels on dense Exadata layouts. Download as .drawio or export to PNG or SVG.
Example prompt
Oracle Database architecture on OCI Exadata Cloud Service. Primary site in us-ashburn-1: Exadata X10M quarter rack with 2 compute nodes running 21c RAC. CDB named FINPROD with 4 PDBs: CORE_BANKING, PAYMENTS, REPORTING, AUDIT. ASM disk groups: +DATA (high redundancy, 50TB usable), +RECO (normal redundancy, 10TB). Data Guard physical standby on Exadata in us-phoenix-1 with max availability protection mode and real-time redo apply. GoldenGate 21c extract from CORE_BANKING PDB replicating to Autonomous Data Warehouse in us-ashburn-1 for real-time analytics. ORDS 23c running on a compute instance pool exposing REST APIs from PAYMENTS PDB. OCI FastConnect 10Gbps between ashburn and phoenix for Data Guard transport. OCI Database Management enabled for performance monitoring. Show redo log transport path, GoldenGate trail files, and ORDS connection flow.
Example diagrams from the gallery
Oracle Autonomous DB vs Oracle RAC vs Oracle Exadata - Architecture Compared
These three Oracle technologies serve different tiers of database workloads. Autonomous Database is fully managed with zero administration. RAC provides high availability through multi-instance clustering. Exadata delivers extreme performance with purpose-built hardware. Their architectural representations differ significantly in component complexity and operational responsibility.
| Feature | Oracle Autonomous DB | Oracle RAC | Oracle Exadata |
|---|---|---|---|
| Management responsibility | Fully managed: Oracle handles patching, tuning, scaling, and backups; user manages schema and SQL only | User manages instances, ASM, clusterware, patching, and backup; Oracle provides the software stack | Shared: Oracle manages storage cells and firmware; user manages database instances, RAC, and ASM on compute nodes |
| Diagram components | Single database icon with wallet connection, private endpoint, and ORDS API layer; minimal infrastructure shown | Multiple instance nodes, shared ASM disk groups, cluster interconnect, SCAN listener, and VIP addresses | Compute nodes, storage cells, InfiniBand switch fabric, ASM disk groups, and optional RAC spanning nodes |
| High availability model | Built-in: automatic failover across fault domains, zero-downtime patching, Autonomous Data Guard for DR | Instance-level failover: if one node fails, surviving nodes take over workload via TAF or Application Continuity | Combines RAC HA with storage cell mirroring; compute or storage cell failures handled by redundant hardware |
| Scaling approach | Auto-scaling OCPU count from 1 to 128; storage scales independently up to 384TB per instance | Add RAC nodes (horizontal) or increase per-node CPU/memory (vertical); requires cluster reconfiguration | Add quarter/half/full racks; scale compute and storage independently within the Exadata configuration |
| Network representation | Private endpoint in a VCN subnet with Network Security Group; no infrastructure networking exposed | Public VIPs, SCAN listeners on the client network, private interconnect on a dedicated VLAN for cache fusion | Client network, backup network, InfiniBand fabric for storage I/O, and management network as separate paths |
| Best suited for | SaaS applications, departmental analytics with ADW, APEX low-code apps, teams without dedicated DBAs | Mission-critical OLTP needing sub-second failover: banking cores, trading platforms, ERP systems | Consolidated database platforms running 50+ databases, data warehouses exceeding 100TB, mixed OLTP/analytics |
When to use this pattern
Use an Oracle Database architecture diagram when you need to document RAC cluster topology, Data Guard replication paths, or GoldenGate stream configurations for operational handbooks and DR runbooks. It's the right choice for documenting Exadata deployments, Autonomous Database integrations with ORDS APIs, or PDB consolidation strategies within a CDB. If your focus is on the broader OCI infrastructure rather than the database internals, use an OCI architecture diagram instead. For entity-relationship modeling of the schema itself, use an ERD diagram. Keep database architecture diagrams focused on nodes, replication, and connectivity rather than table structures or SQL execution plans. Don't combine database internals with application-level service diagrams on the same canvas. Use a system architecture diagram for that.
Frequently asked questions
Can the generator show PDB/CDB container architecture?
Yes. Describe your CDB and PDB names in the prompt. The AI renders PDBs as nested containers inside the CDB boundary, each labeled with its service name. This Oracle Database architecture diagram generator follows RULE-06 to group related PDBs logically. Data Guard and GoldenGate arrows connect at the PDB or CDB level depending on your replication scope.
How does the AI represent Data Guard replication?
Data Guard renders as directional arrows from primary to standby database icons. The arrows carry labels showing protection mode (maximum availability, maximum performance, or maximum protection) and transport type (synchronous or asynchronous redo). If you specify real-time apply, the standby icon shows an apply indicator.
Can I diagram GoldenGate replication flows?
Yes. Specify extract and replicate process details in your prompt. The AI draws the GoldenGate trail path from source to target with labeled process icons for extract, data pump, and replicate. Bidirectional replication renders as two parallel streams with conflict resolution annotations if you describe the resolution strategy.
Does it support Exadata architecture diagrams?
Yes. Describe your Exadata configuration including compute nodes, storage cells, and InfiniBand fabric. The AI renders compute and storage as separate grouped tiers connected by the InfiniBand switch. ASM disk groups appear as shared storage icons. VLM visual validation catches label overlaps on dense multi-rack Exadata layouts.
What warnings apply to Oracle Database diagrams?
WARN-03 flags databases without any standby, replica, or backup target. WARN-04 triggers when production and reporting databases share network segments without a security boundary. WARN-05 catches ambiguous components like unnamed database instances. Warnings appear as annotations on the diagram without blocking generation.
Related diagram generators
Generate OCI Architecture Diagrams from Text with AI
Describe your Oracle Cloud infrastructure in plain English. Get a valid Draw.io diagram with compartment hierarchies, VCN boundaries, and availability domain placement.
Generate Entity-Relationship Diagrams from Text with AI
Describe your database schema in plain English. Get a valid Draw.io ERD with Crow's Foot notation, cardinality markers, and primary/foreign key labels.
Generate Data Flow Diagrams from Text with AI
Describe how data moves through your system. Get a valid Draw.io DFD with Yourdon-DeMarco notation, decomposition levels, and named data flows.
Generate System Architecture Diagrams from Text
Describe your system's components in plain English. Get a valid Draw.io diagram with services, databases, message queues, caches, and API connections.