How to Create Oracle Cloud (OCI) Architecture Diagrams
Oracle Cloud Infrastructure has a compartment-based resource hierarchy, a networking model built on VCNs and DRGs, and first-party .drawio support in its diagram toolkit. This tutorial covers how to produce accurate OCI architecture diagrams with specific prompts for compartment design, networking, Autonomous Database, and security architectures.
OCI diagram toolkit and .drawio compatibility: what Oracle provides natively
Oracle is one of the few cloud providers that publishes its architecture icons in .drawio-compatible format. The OCI Architecture Diagram Toolkit includes SVG icons for every OCI service, pre-built .drawio templates for common architectures, and stencil files that load directly into Draw.io. This means OCI diagrams have unusually good tooling support compared to other cloud providers where you need to import icon packs manually. The toolkit organizes icons into categories that mirror OCI's service console: Compute, Networking, Storage, Database, Security, Observability, Developer Services, and Governance. Each icon uses Oracle's red-and-black color scheme with consistent sizing. The icons follow a flattened design language with clear silhouettes that remain recognizable at small sizes in dense diagrams. Diagrams.so includes the OCI icon library in its 30+ icon sets. When you select Oracle Cloud as your provider, the AI maps OCI service names to the correct icons per RULE-02. Write "OCI Object Storage" and you get the Object Storage bucket icon. Write "Oracle Autonomous Data Warehouse" and you get the ADW icon with its warehouse symbol. This automatic mapping eliminates the time you'd spend searching the toolkit for the right shape. The .drawio compatibility matters for workflow. Many OCI customers already use Draw.io for their architecture documentation because Oracle's own toolkit targets that format. Generating diagrams in Diagrams.so and exporting as .drawio produces files that open alongside their existing diagram library without format conversion. Teams can generate the initial diagram with AI, then refine it in Draw.io or the VS Code extension, maintaining a single file format throughout the lifecycle. Oracle also publishes reference architectures on the OCI Architecture Center. These reference diagrams use a consistent visual style: compartment boundaries as rounded rectangles with headers, VCN boundaries with CIDR labels, subnet boundaries with color-coded access types (public green, private blue). Diagrams.so follows these conventions, so generated diagrams match the visual language that OCI architects expect.
Compartment hierarchy design: organizing OCI resources for governance and billing
OCI compartments are the primary organizational unit for resources, access control, and billing. Unlike AWS accounts or Azure subscriptions, OCI compartments are hierarchical within a single tenancy. You can nest compartments up to six levels deep, and IAM policies applied at a parent compartment cascade to children. Getting the compartment hierarchy right is the first step in any OCI architecture, and diagramming it correctly communicates your governance model. Here's a prompt for an OCI compartment hierarchy: "OCI tenancy architecture with compartment hierarchy. Root compartment at the top. Level 1: Network compartment (shared VCNs, DRGs, and DNS), Security compartment (Cloud Guard, Vault, Bastion), Shared Services compartment (Object Storage for logs, Streaming service, Notifications), Production compartment, and Non-Production compartment. Under Production: Web Tier compartment (Load Balancer, WAF, Compute instances), App Tier compartment (Container Instances, Functions), Data Tier compartment (Autonomous Transaction Processing, Object Storage). Under Non-Production: Development compartment and Staging compartment, each with their own Web, App, and Data sub-compartments mirroring Production. IAM policies: NetworkAdmins group manages Network compartment, SecurityAdmins group manages Security compartment, DevTeam group manages Non-Production but can only read Production. Budget alerts at Production and Non-Production compartments with monthly thresholds." The generated diagram shows a tree structure flowing top to bottom. The root compartment spans the full width. Level 1 compartments appear as five blocks beneath it. Production and Non-Production expand further to show their sub-compartments. IAM policy arrows connect from groups on the left side to their respective compartments, with policy scope labels (manage, read, use). Budget alert icons attach to Production and Non-Production boundaries. This hierarchical view is essential for OCI governance reviews. Auditors ask "who can access what" and the compartment diagram answers that question visually. The cascade behavior of IAM policies means a policy granting access at the Production compartment automatically grants it to Web Tier, App Tier, and Data Tier. Showing this hierarchy makes the blast radius of any IAM policy change immediately visible. Diagrams.so renders compartment boundaries as nested rounded rectangles with distinct background colors, matching the OCI Architecture Center style. The AI also handles the depth correctly: six levels of nesting remain readable because each level gets progressively lighter shading.
OCI networking with VCN, DRG, and cross-region peering
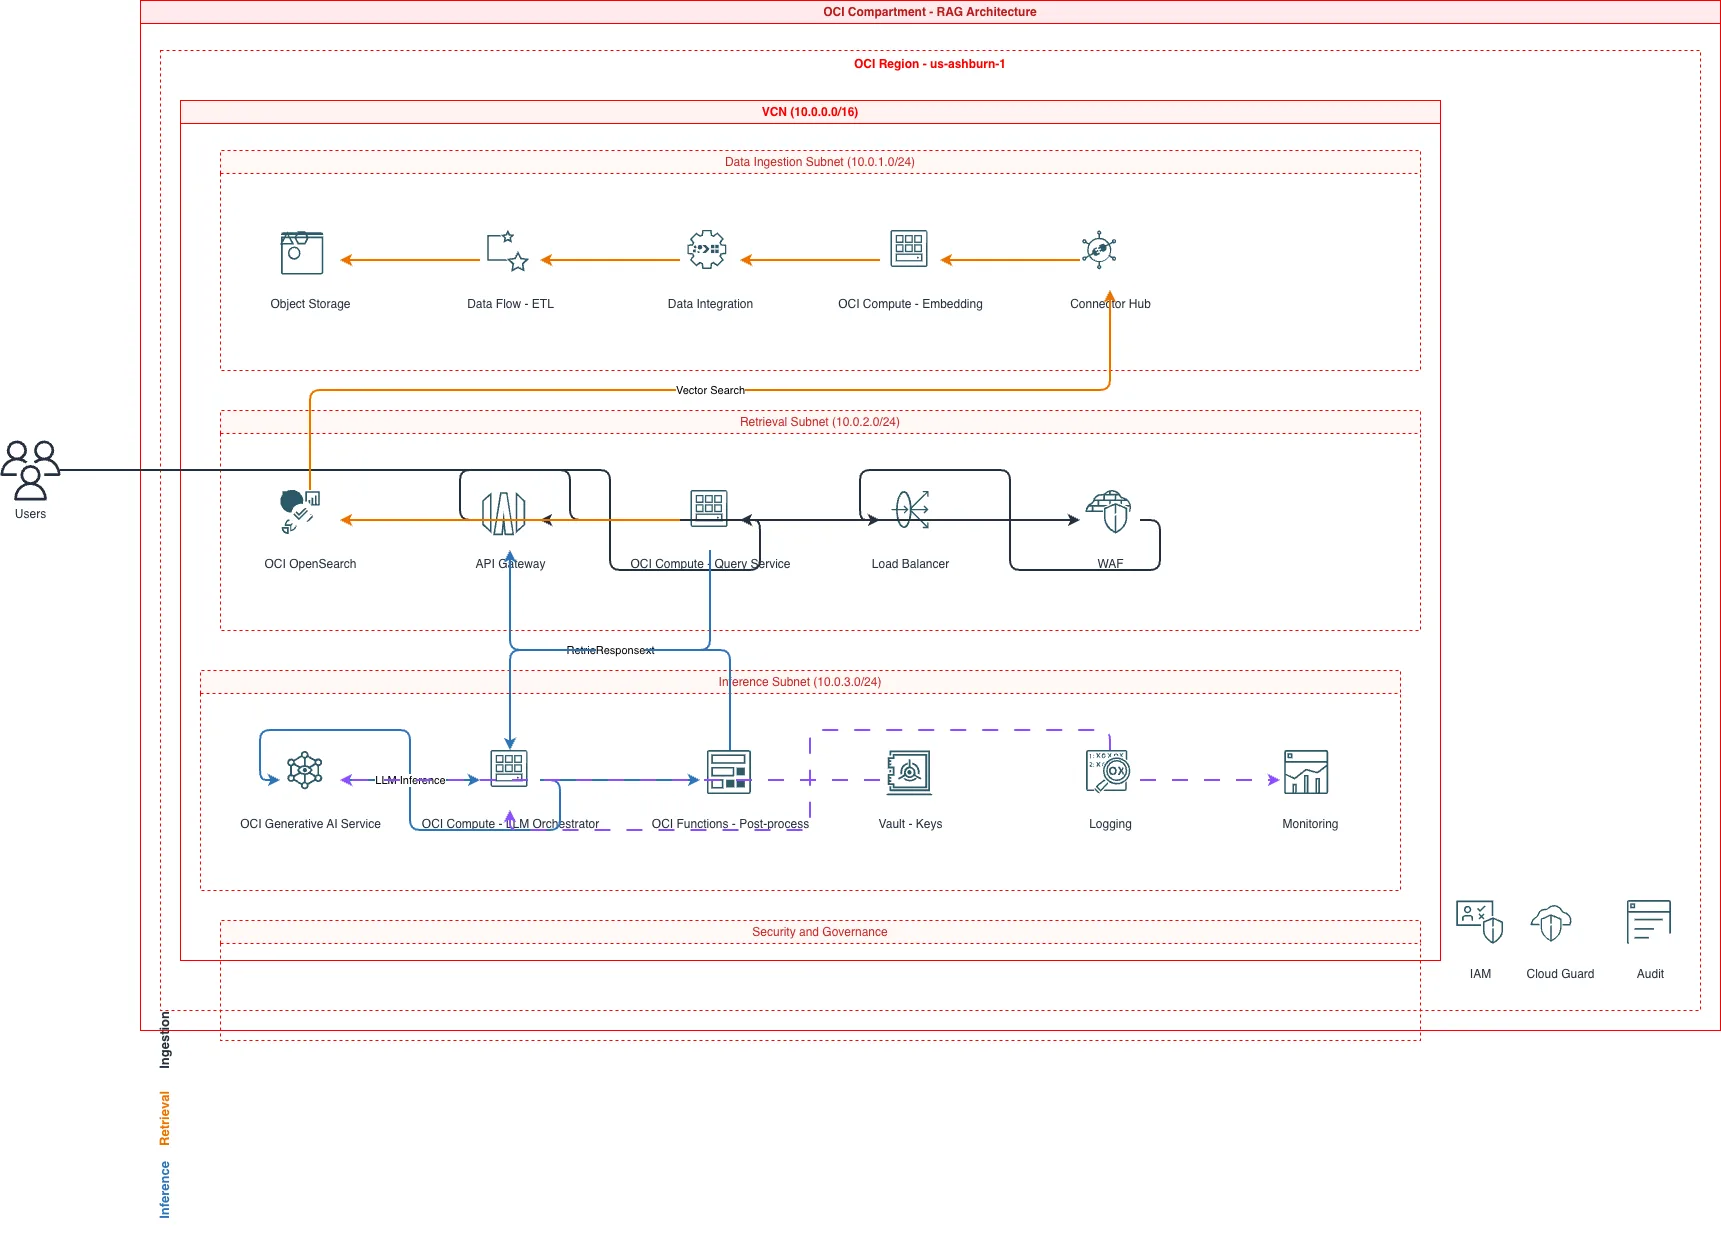
OCI networking centers on the Virtual Cloud Network (VCN), Dynamic Routing Gateway (DRG), and a security list/NSG model that differs from AWS and Azure. The DRG is particularly important because it serves as the single hub for VCN peering, FastConnect (private connectivity), IPSec VPN, and cross-region connectivity. Diagramming OCI networking means showing the DRG as the central routing hub, not as a peripheral component. Use this prompt for an OCI networking diagram: "OCI hub-spoke networking architecture across two regions. Primary region: Ashburn (us-ashburn-1). Hub VCN (10.0.0.0/16) contains DRG v2 as the central router. Hub VCN has a public subnet with Network Load Balancer and Bastion service, and a private subnet with Network Firewall inspecting all east-west traffic. Three spoke VCNs peered to DRG: Web VCN (10.1.0.0/16) with public subnet for WAF and Load Balancer, App VCN (10.2.0.0/16) with private subnets only running Container Instances, Data VCN (10.3.0.0/16) with private subnets only for Autonomous Database and Object Storage private endpoint. All spoke-to-spoke traffic routes through Network Firewall in hub VCN via DRG route tables. FastConnect 10Gbps connection from DRG to on-premises data center. DR region: Phoenix (us-phoenix-1). Identical hub-spoke topology with DRG. Remote VCN peering between Ashburn DRG and Phoenix DRG. Oracle Data Guard replicates Autonomous Database from Ashburn to Phoenix in standby mode. Object Storage cross-region replication for backup buckets." The generated diagram splits into two region blocks side by side. In each region, the DRG sits at the center of a hub-spoke arrangement. The hub VCN wraps around the DRG with Network Firewall and Bastion in their respective subnets. Spoke VCNs radiate outward with peering connections to the DRG shown as bidirectional arrows. FastConnect exits the Ashburn DRG to an on-premises icon on the left. Remote VCN peering connects the two DRGs across the region boundary. Data Guard replication shows as an arrow between the two Autonomous Database instances with a "standby" label on the Phoenix side. The route table visualization is what makes this diagram useful for network reviews. OCI uses DRG route tables to control traffic flow between attachments (VCN peers, FastConnect, VPN). Showing that spoke-to-spoke traffic routes through the hub VCN's Network Firewall communicates the inspection policy. Without this detail, the diagram implies direct spoke-to-spoke communication, which misrepresents the actual traffic flow. WARN-01 fires if your prompt only mentions a single region without DR. WARN-04 fires if subnets lack security list or NSG definitions. Both warnings push you toward a more complete networking diagram.
Oracle Autonomous Database architecture: provisioning, connectivity, and Data Guard
Oracle Autonomous Database (ADB) is OCI's fully managed database service available in two variants: Autonomous Transaction Processing (ATP) for OLTP workloads and Autonomous Data Warehouse (ADW) for analytics. Diagramming ADB correctly means showing the Exadata infrastructure it runs on, the connectivity model (private endpoint vs public), and the Data Guard configuration for HA and DR. Here's a prompt for an ADB-focused architecture: "Oracle Autonomous Database architecture for enterprise application. Autonomous Transaction Processing instance on Dedicated Exadata Infrastructure in a private subnet within the Data VCN. Private endpoint with NSG allowing connections only from the App VCN (10.2.0.0/16) on port 1522 using mTLS. Autonomous Data Guard standby in a separate availability domain within the same region for local HA, plus a cross-region standby in Phoenix for DR with a recovery time objective of 60 seconds. Application tier: OCI Container Instances running Java microservices in the App VCN, connecting to ATP through a service gateway for private, backbone-only traffic. Oracle GoldenGate for real-time data replication from ATP to ADW for analytics workloads. ADW instance in the same Data VCN with private endpoint, accessed by OCI Data Integration for ETL pipelines and Oracle Analytics Cloud for dashboards. OCI Vault stores the wallet credentials for mTLS connections. Database Management service monitors both ATP and ADW with performance insights and SQL tuning advisor." The generated diagram shows the Data VCN as the primary boundary containing ATP on the Dedicated Exadata Infrastructure, drawn as a server rack icon inside a compartment. The private endpoint icon sits on the VCN boundary with NSG rules. Autonomous Data Guard arrows point to the local standby (different AD, same region) and the remote standby (Phoenix region, shown as a separate region block). The App VCN connects to the Data VCN via service gateway, shown as a gateway icon on the VCN boundary. Container Instances in the App VCN send arrows through the service gateway to ATP. GoldenGate sits between ATP and ADW with bidirectional replication arrows labeled "real-time CDC." ADW connects rightward to Data Integration and Analytics Cloud. OCI Vault sits above with wallet credential arrows pointing to both database instances. Database Management spans the bottom with monitoring arrows to both ATP and ADW. The Dedicated Exadata Infrastructure detail is important for enterprise customers. Shared infrastructure (the default) runs on multi-tenant Exadata. Dedicated infrastructure gives you isolated Exadata hardware. The diagram should make this distinction clear because it affects security posture, performance guarantees, and pricing. WARN-03 fires if any database appears without HA configuration, which would catch an ADB without Data Guard.
OCI security architecture: Security Zones, Cloud Guard, and Vault
OCI's security model includes three components that other clouds don't have direct equivalents for: Security Zones, Cloud Guard, and Maximum Security Zones. Security Zones enforce security policies at the compartment level. Once enabled on a compartment, you cannot create resources that violate the zone's policies: no public buckets, no unencrypted storage, no instances without monitoring. Cloud Guard continuously monitors resource configurations and recommends or auto-remediates violations. Here's a prompt for an OCI security architecture: "OCI security architecture for regulated workload. Security Zone enabled on the Production compartment, enforcing: all Object Storage buckets are private, all Block Volumes use customer-managed encryption keys, all Compute instances have monitoring enabled, no public IP addresses on instances. Cloud Guard in the Security compartment with three detector recipes: Configuration detector monitoring all compartments for policy violations (public buckets, open security lists, unencrypted volumes). Activity detector monitoring audit logs for suspicious admin actions (IAM policy changes, security list modifications, user creation). Threat detector using OCI threat intelligence feeds for known malicious IPs in VCN Flow Logs. Cloud Guard responder recipes: auto-remediate public buckets by making them private, auto-disable compromised user accounts, create OCI Events and Notifications for all critical findings. OCI Vault in Security compartment with HSM-backed master encryption keys. Key management policies: rotate keys every 90 days, keys can only be used by resources in the Production compartment. OCI Bastion service as the only SSH access path to Production instances, with session recording to Object Storage. Audit logs from all compartments stream to a dedicated logging compartment with immutable Object Storage bucket using retention rules." The generated diagram shows the Security Zone as a highlighted boundary around the Production compartment with policy icons indicating the enforced rules. Cloud Guard sits in the Security compartment with three detector types fanning out as monitoring arrows that span all compartments. Responder arrows point from Cloud Guard back to specific resource types (Object Storage, IAM). OCI Vault appears with key icons and rotation cycle indicators. Bastion service sits at the boundary of the Production compartment as the sole entry point, with session recording arrows to Object Storage. Audit logs flow from every compartment to the logging compartment, shown as collection arrows converging on an immutable storage icon. The immutability is represented by a lock badge on the Object Storage bucket, which is critical for compliance: auditors need to know that log data cannot be tampered with. This security architecture view is required for OCI customers in financial services, healthcare, and government sectors. The Security Zone and Cloud Guard combination provides preventive (Security Zone blocks non-compliant resources) and detective (Cloud Guard monitors for violations) controls. Making both visible in the diagram demonstrates defense-in-depth to compliance reviewers. WARN-04 fires if security boundaries are missing, and the warnings help ensure that the diagram captures the full security posture.
Why OCI diagrams often get neglected and how to fix it with AI generation
OCI is the fourth-largest cloud provider, but its architecture diagrams receive disproportionately less attention than AWS, Azure, or GCP. This happens for several practical reasons, and each one has a fix. First, fewer community templates exist. AWS and Azure have thousands of community-contributed diagram templates on Draw.io, Lucidchart, and other tools. OCI has the official Architecture Center templates and not much else. When you start an OCI diagram from scratch, there's no template to modify, so you draw from a blank canvas. Fix: use Diagrams.so to generate the initial diagram from a prompt. The AI knows OCI service names, icons, and layout conventions. You get a starting point in 10 seconds instead of 30 minutes of manual work. Second, team expertise is often concentrated. Many organizations have OCI expertise in a small database team that migrated from on-premises Oracle. They know the database layer inside out but may not document the networking and compute layers with the same rigor. The resulting diagrams show detailed database architecture and hand-wavy compute and networking. Fix: use specific prompts for each architecture layer. Generate the networking diagram separately from the database diagram separately from the compute diagram. Each prompt forces you to be specific about that layer. Third, OCI's naming conventions are longer than other providers. "Autonomous Transaction Processing on Dedicated Exadata Infrastructure" is a mouthful compared to "Aurora PostgreSQL." This verbosity discourages people from writing detailed prompts. Fix: Diagrams.so recognizes both full names and common abbreviations. "ATP Dedicated" maps to the same icon as the full name. "ADB-D" works too. The AI resolves abbreviations against the OCI icon library. Fourth, hybrid architectures between OCI and on-premises Oracle are common but hard to diagram. The OCI-to-on-premises connection via FastConnect, the Data Guard configuration between on-premises Oracle Database and OCI Autonomous Database, and the DNS resolution across both environments add complexity that people avoid drawing. Fix: include the on-premises components in your prompt. "On-premises Oracle Database 19c in the corporate data center, connected to OCI via FastConnect 10Gbps, with Data Guard asynchronous replication to Autonomous Database in Ashburn" gives the AI enough context to draw the hybrid boundary with the correct connectivity. Fifth, OCI updates its service portfolio faster than documentation keeps up. OCI Container Engine for Kubernetes (OKE), OCI DevOps, and OCI Functions have all evolved significantly in the past year. Diagrams that reference outdated service names or capabilities mislead new team members. Fix: generating fresh diagrams from current architecture descriptions ensures the diagram matches what's actually deployed. Pair this with Diagrams.so's architecture warnings (WARN-05 flags ambiguous component names) to catch any service references that need updating. The core message: OCI architectures deserve the same diagramming quality as AWS and Azure. The tooling gap has closed. The AI knows OCI. Your prompts just need to be specific about the OCI services you're using.
Related diagrams from the gallery
Try these diagram generators
Generate OCI Architecture Diagrams from Text with AI
Describe your Oracle Cloud infrastructure in plain English. Get a valid Draw.io diagram with compartment hierarchies, VCN boundaries, and availability domain placement.
Generate OCI Networking Diagrams from Text with AI
Describe your Oracle Cloud network topology in plain English. Get a valid Draw.io diagram with VCN subnets, gateways, Security Lists, and DRG hub-spoke routing.
Generate Oracle Database Architecture Diagrams from Text with AI
Describe your Oracle Database topology in plain English. Get a valid Draw.io diagram with RAC nodes, Data Guard standby, PDB/CDB containers, and replication flows.