Draw.io vs Lucidchart vs Miro: 2026 Comparison for Architects
Draw.io, Lucidchart, and Miro solve different problems despite appearing in the same "diagramming tools" category. This comparison breaks down pricing, file formats, cloud provider icons, and collaboration features so you can pick the right tool for your team.
What each tool is actually for: they serve different primary purposes
Draw.io vs Lucidchart vs Miro is the wrong comparison if you don't first understand what each tool was built to do. They overlap on features, but their core purposes diverge. Draw.io (now called diagrams.net) is a free, open-source diagramming tool focused on technical diagrams. It started as a web app for creating flowcharts and network diagrams, and it's evolved into the default diagramming tool for engineering teams that want zero licensing overhead. It runs in the browser, as a desktop app (Electron), as a VS Code extension, and as a Confluence/Jira plugin. The file format is XML (mxGraphModel), which is plain text, diffable, and version-controllable. You can commit .drawio files to Git and see meaningful diffs. Lucidchart is a commercial SaaS diagramming platform built for cross-functional collaboration. It handles technical diagrams but also organizational charts, process flows, wireframes, and data modeling. Its core strength is real-time multiplayer editing with commenting, revision history, and integrations with Google Workspace, Microsoft 365, Slack, and Confluence. Lucidchart is designed for teams where non-engineers need to view and comment on diagrams. Miro is a digital whiteboard platform, not a diagramming tool. Its primary use case is visual collaboration: brainstorming, retrospectives, user story mapping, and workshop facilitation. Miro has basic diagramming capabilities and you can create flowcharts and architecture diagrams in it, but the experience is optimized for freeform canvas work. Shapes don't snap to grid by default. There's no structured export format. The output is a visual canvas, not a technical document. The confusion comes from feature lists. All three can create boxes with arrows between them. But Draw.io gives you structured XML output with precise component types. Lucidchart gives you a collaborative editing environment with approval workflows. Miro gives you an infinite canvas for visual thinking. If you're creating architecture diagrams that need to be version-controlled and edited over months, Draw.io's format is the right choice.
Pricing comparison: free tiers, team plans, and enterprise costs
Draw.io is free. Completely free. The web app at diagrams.net costs nothing. The desktop app costs nothing. The VS Code extension costs nothing. The Confluence Cloud plugin has a free tier for up to 10 users and costs $1.27 per user per month after that. The Jira plugin follows the same model. There are no premium features locked behind a paywall. Every shape library, every export format, every integration is available for free. This is the single biggest differentiator and it's often underweighted in tool comparisons. Lucidchart has a free tier limited to 3 editable documents with 60 shapes per document. For any real work, you need a paid plan. Individual plans start at $7.95 per month billed annually. Team plans start at $9 per user per month billed annually, with a minimum of 3 users. Enterprise plans require a sales call and typically land between $12 and $20 per user per month depending on volume and features like SSO, advanced admin controls, and data governance. A team of 20 architects on the Team plan costs $2,160 per year. Miro has a free tier limited to 3 boards with anonymous visitors. The Starter plan is $8 per member per month billed annually. The Business plan is $16 per member per month billed annually and adds SSO, advanced guest access, and more integrations. Enterprise pricing starts at custom quotes, typically $20+ per user per month. Miro's pricing is comparable to Lucidchart, but you're paying for a whiteboard with diagramming bolted on, not a dedicated diagramming tool. For teams that only need architecture diagrams, Draw.io's zero cost is hard to argue against. The money saved on diagramming licenses can go toward tools that actually need commercial support. If your team needs real-time collaborative editing with Slack integration and SSO, Lucidchart's Team plan at $9 per user per month is the reasonable choice. Miro only makes sense if your team already uses it for workshops and retrospectives and wants to keep diagrams in the same workspace.
File format and portability: .drawio XML vs proprietary formats
This is the section that matters most for long-term architecture documentation. File format determines whether your diagrams survive tool migrations, whether they work in CI/CD pipelines, and whether you can diff them in pull requests. Draw.io uses mxGraphModel XML. It's an open format, fully documented, and human-readable if you need to edit it manually. A .drawio file is a text file. You can commit it to Git, review changes in a pull request, and see exactly which components were added, moved, or deleted. The VS Code extension renders .drawio files inline, so developers can view and edit diagrams without leaving their editor. Confluence embeds .drawio files natively with the diagrams.net plugin. The format supports multiple pages (tabs), layers, and custom metadata. Lucidchart uses a proprietary format internally. You can export to PNG, SVG, PDF, Visio (.vsdx), and .drawio format. But the native format is not accessible outside Lucidchart's platform. If Lucidchart raises prices or shuts down, your diagrams are locked in unless you've been exporting regularly. The Visio export is good for Microsoft shops. The .drawio export is the escape hatch for teams that want portability. Miro has no structured diagram export. You can export boards as PNG, SVG, or PDF images. There's no XML, no structured format, no way to extract individual components programmatically. If you build architecture diagrams in Miro and later need to move to Draw.io or Lucidchart, you're recreating them from scratch. The visual export is just pixels. For architecture diagrams specifically, portability is non-negotiable. Teams change tools every 2 to 3 years. Engineers change jobs every 3 to 5 years. Diagrams should outlive the tool that created them and the person who created them. .drawio XML achieves this. Proprietary formats don't. When evaluating any diagramming tool, ask: "Can I open this file in 5 years without paying for the tool that created it?" For .drawio files, the answer is always yes.
Cloud provider icon support: official AWS, Azure, and GCP icon libraries
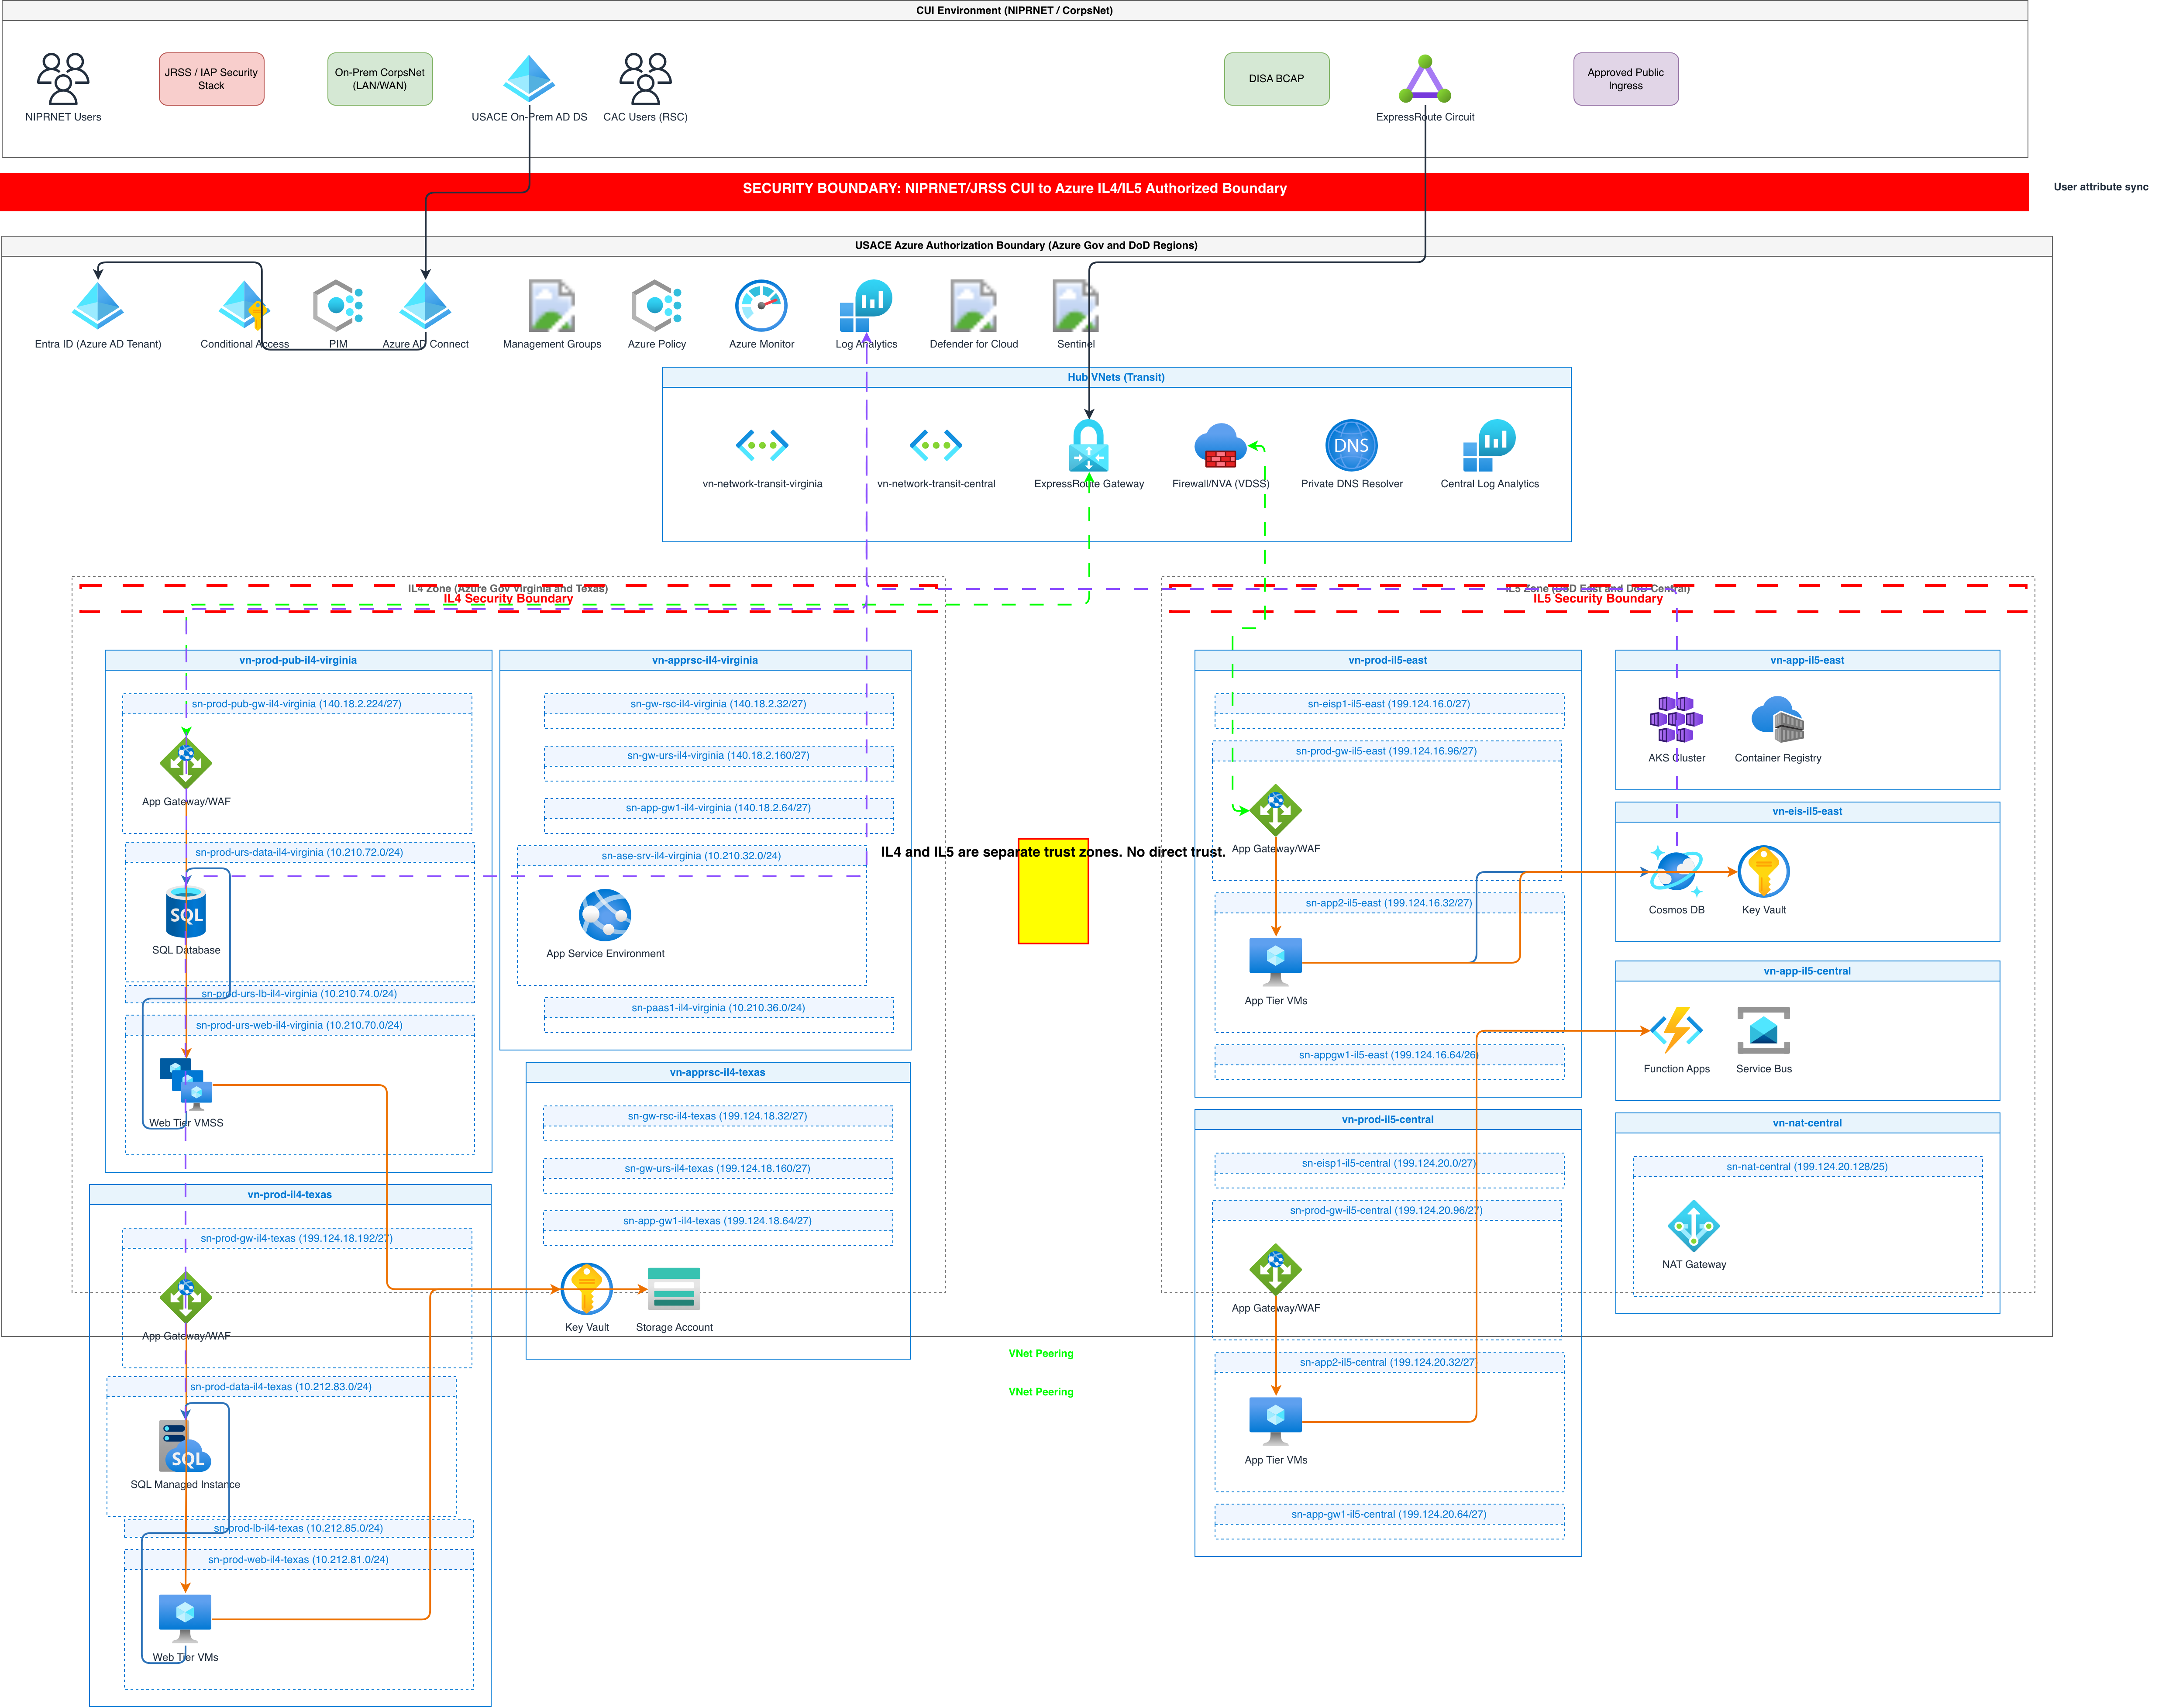
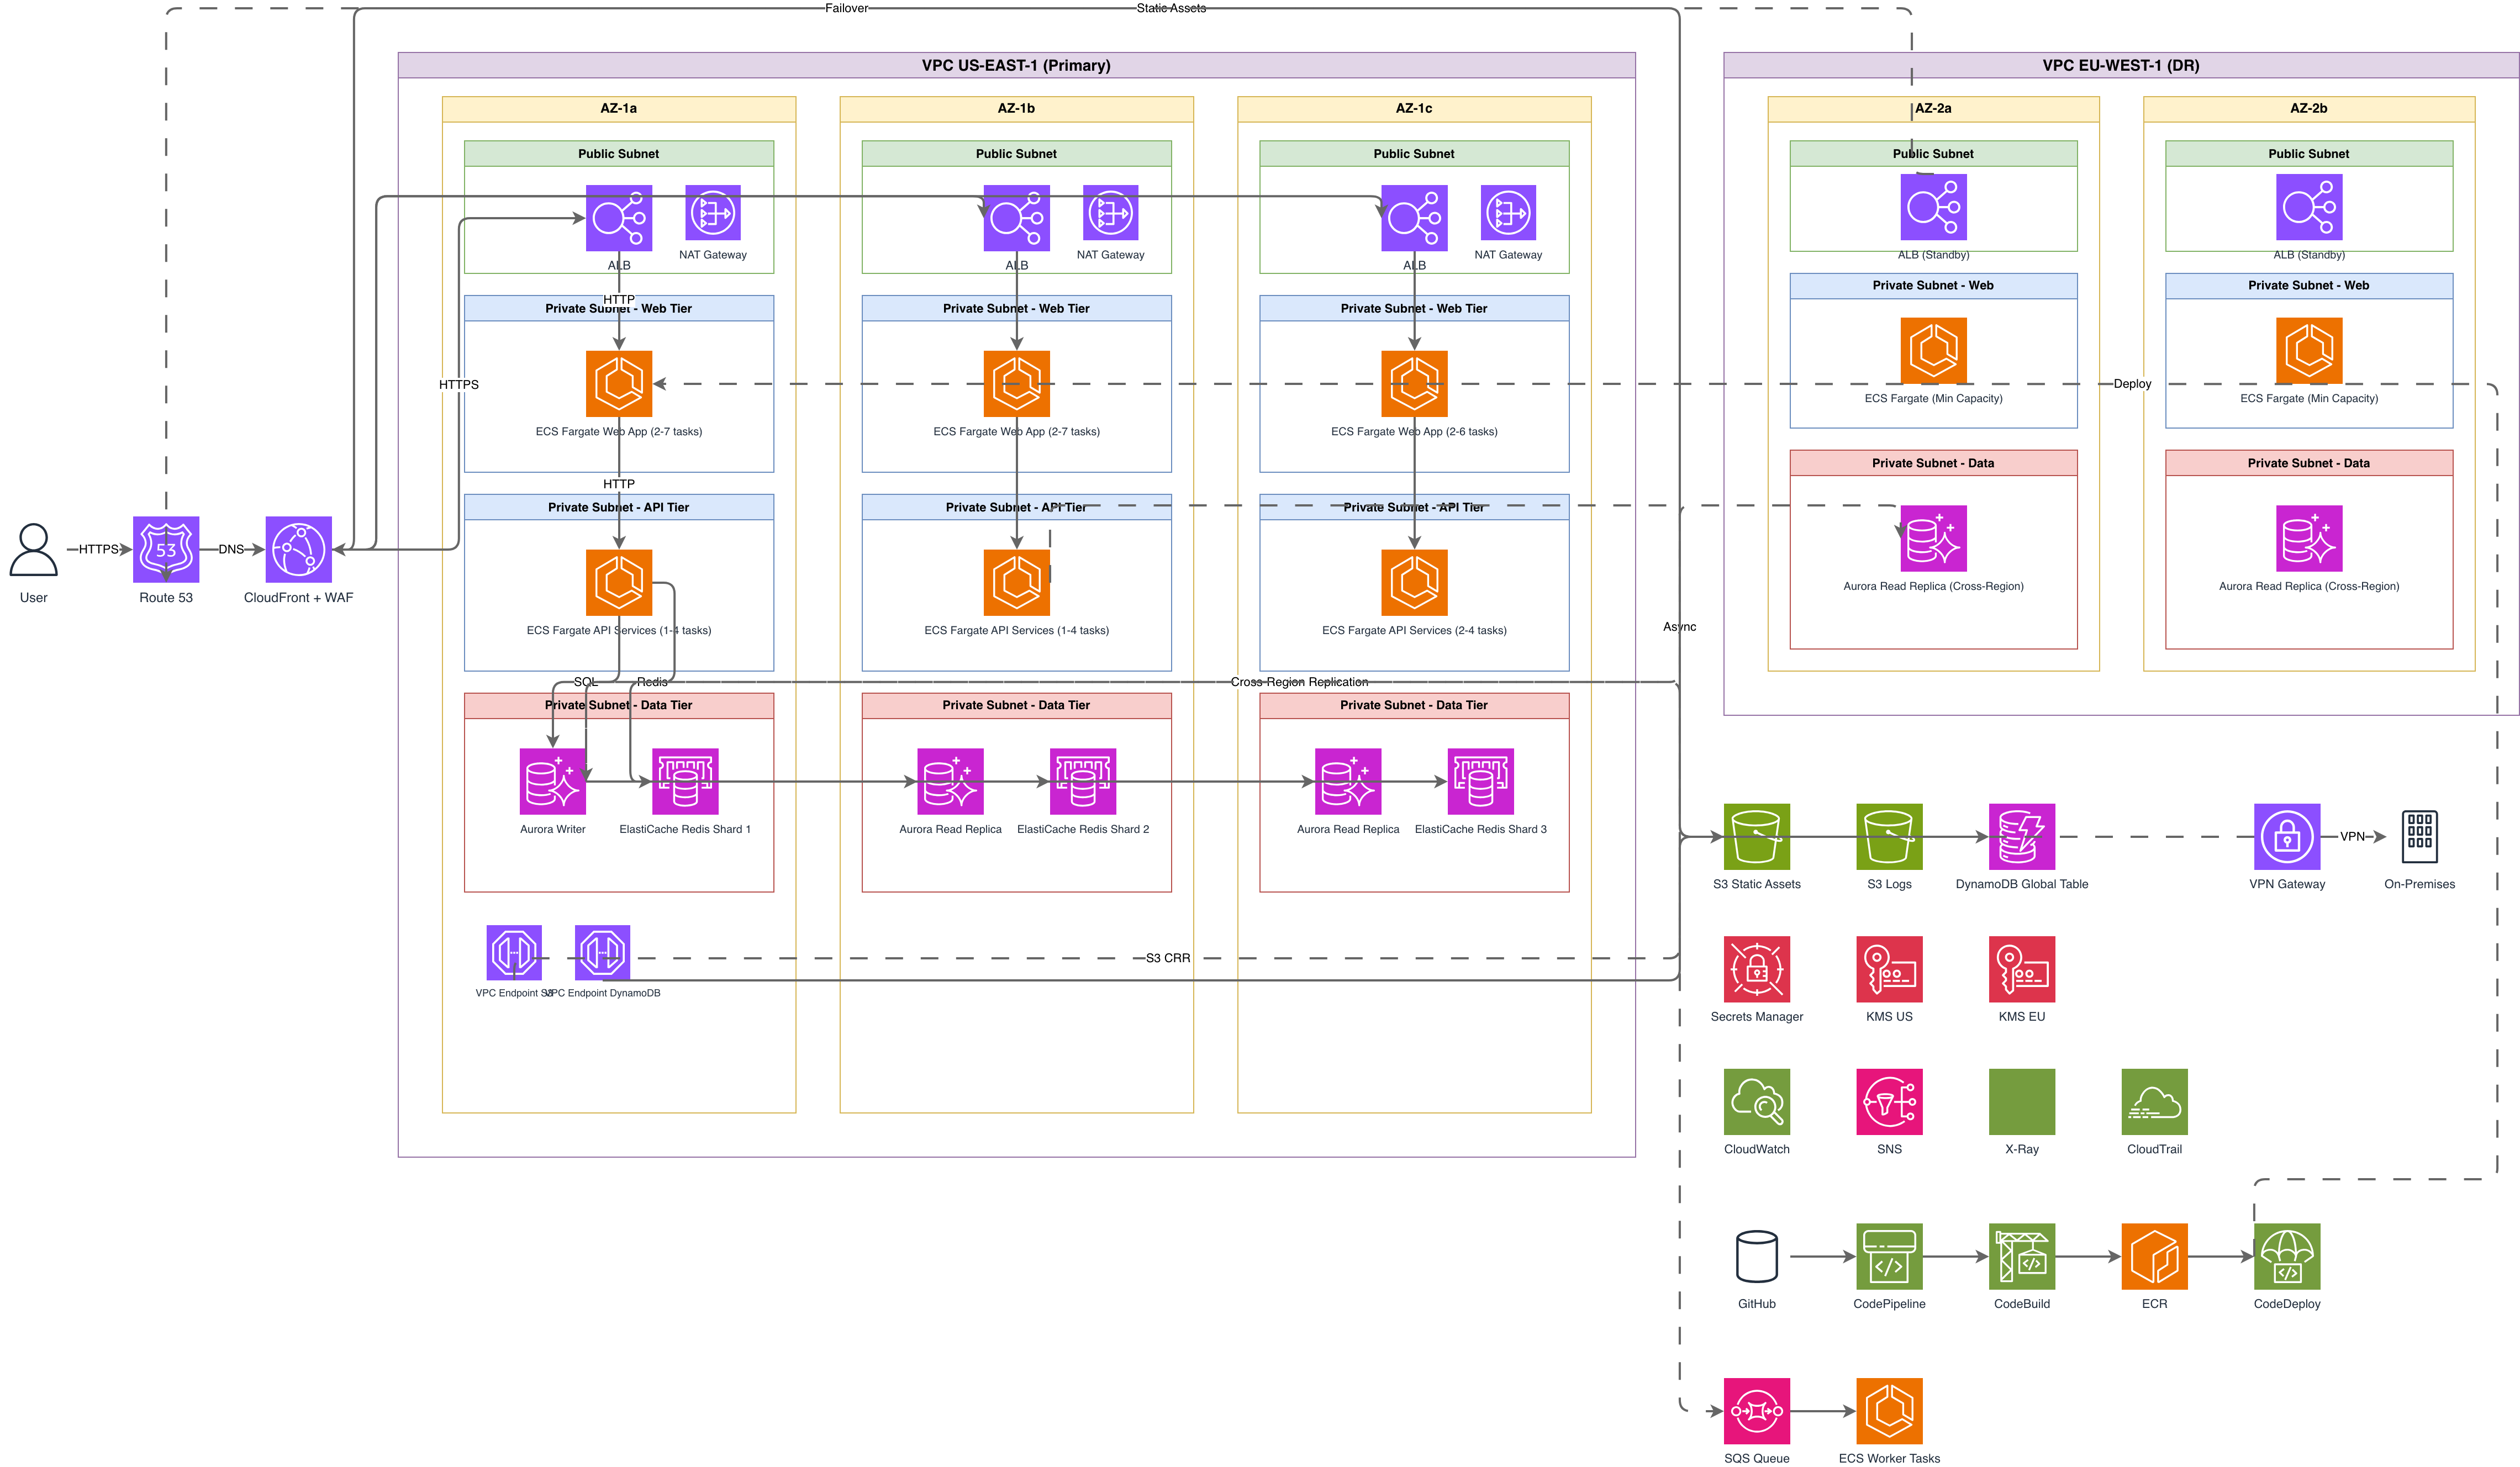
Architecture diagrams for cloud infrastructure need official cloud provider icons. Generic boxes with text labels slow down design reviews and introduce ambiguity. A reviewer should glance at an icon and know whether it's an ALB or an NLB, an S3 bucket or an EBS volume, a Lambda function or a Fargate task. Draw.io ships with official AWS, Azure, and GCP icon libraries built in. Open the shape panel, search for "AWS" and you get the complete AWS Architecture Icons set with 900+ icons organized by service category (Compute, Storage, Database, Networking, Security, Machine Learning). Azure and GCP have equivalent built-in libraries. These libraries are updated periodically as cloud providers release new services. You can also import custom shape libraries from XML files if a service is missing. Lucidchart also has official cloud provider icon libraries, and they're well maintained. AWS, Azure, and GCP icons are available in the shape panel for paid plans. The free tier has limited shape access, which may not include all cloud icons. Lucidchart's cloud icons are functionally equivalent to Draw.io's for diagramming purposes. The difference is you're paying for access. Miro has basic cloud architecture templates and some icon sets, but coverage is incomplete compared to Draw.io and Lucidchart. You'll find common services like EC2, S3, Lambda, and RDS, but niche services like AWS App Runner, Amazon MemoryDB, or Azure Container Apps may be missing. For teams that diagram across all three major cloud providers, Miro's icon coverage is a limitation. Diagrams.so loads from 30+ icon libraries including all three major cloud providers, Kubernetes CNCF icons, and general architecture shapes. When you select a cloud provider in the generator, the AI uses the correct icons from that provider's official set. The generated .drawio file contains the icon references, so when you open it in Draw.io desktop or the VS Code extension, the icons render correctly without any additional library installation.
Collaboration features: real-time editing, commenting, and versioning
Real-time collaboration is Lucidchart's strongest advantage over Draw.io. Multiple users can edit the same diagram simultaneously with cursor presence indicators, live updates, and in-line comments on specific shapes. This works well for design sessions where an architect is building a diagram while the team comments and suggests changes in real time. The revision history lets you roll back to any previous version. The commenting system supports threaded discussions tied to specific diagram elements. Draw.io's collaboration story depends on where you host the file. On Confluence Cloud with the diagrams.net plugin, you get basic co-editing with autosave and conflict resolution. On Google Drive, Draw.io supports real-time collaborative editing through Google's infrastructure. In Git repositories, collaboration happens through the normal pull request workflow: you edit the .drawio file, commit, push, and the reviewer sees the visual diff. This is less fluid than Lucidchart's real-time editing but it integrates naturally with existing engineering workflows. For teams that already use Git for everything, the .drawio-in-Git approach means diagrams go through the same review process as code. Miro's collaboration is its defining feature. Real-time cursors, sticky notes, voting dots, timer widgets, video chat integration, and presentation mode. For running a design workshop where you're brainstorming architecture options, Miro is unmatched. The problem is that the workshop output (scattered sticky notes around a rough diagram) needs to be translated into a structured architecture diagram afterward. Miro is the brainstorming tool. Draw.io or Lucidchart is the documentation tool. Versioning matters differently for each tool. Lucidchart stores versions internally with a visual timeline. Draw.io files versioned in Git have commit history, branch comparisons, and blame annotations. Miro has board version history but no way to diff two versions visually at the component level. For architecture diagrams that evolve over months, Git-based versioning with .drawio files gives you the most detailed change tracking.
When to use which: a decision framework based on team and use case
Use Draw.io when: your team is primarily engineers, you want diagrams in version control, you need zero licensing cost, you value file portability over real-time collaboration, you're generating diagrams programmatically or with AI tools, or you're in a regulated environment where data sovereignty matters (Draw.io can run fully offline). Draw.io is the right choice for architecture documentation that lives alongside code. Use Lucidchart when: your team includes non-engineers who need to view and comment on diagrams, you need real-time multi-user editing, your organization already has a Lucidchart license through an enterprise agreement, you need built-in integrations with Google Workspace or Microsoft 365, or you need org chart and process mapping in the same tool as architecture diagrams. Lucidchart is the right choice for cross-functional teams where the diagram is a communication tool, not just documentation. Use Miro when: your primary activity is brainstorming and workshopping, you run design sprints or retrospectives and want diagrams in the same workspace, your team needs an infinite canvas for freeform visual thinking, or diagrams are a secondary artifact alongside sticky notes, user flows, and mind maps. Miro is the right choice for discovery and ideation, not for production architecture documentation. Don't pick one tool and force it into every use case. Many teams use Miro for the design workshop, export rough sketches, then recreate the final architecture diagram in Draw.io for documentation. Some teams use Lucidchart for initial collaborative design sessions, then export to .drawio for long-term storage in Git. The tools are complementary, not exclusive. The mistake is using Miro for production architecture docs (no structured export) or using Draw.io for collaborative workshops (limited real-time features).
The AI generation angle: how Diagrams.so fits into the tool landscape
AI diagram generation adds a fourth option to the landscape, and it changes the calculus. Instead of choosing between tools based on their editor experience, you can generate the diagram from text and then choose where to edit it based on the output format. Diagrams.so generates native .drawio XML. That means every generated diagram opens in Draw.io desktop, the VS Code extension, Confluence, or any tool that reads mxGraphModel XML. You're not locked into a rendering engine or a SaaS platform. The generated file is yours. You own the XML. Commit it to Git, email it to a vendor, embed it in Notion, print it on a poster. The .drawio format goes everywhere. The generation workflow addresses the blank canvas problem that plagues all three tools. Starting a diagram from scratch in Draw.io means searching for the right shapes, dragging them onto the canvas, connecting them with arrows, adjusting layout, and aligning to grid. In Lucidchart, the same process plus you're paying per seat. In Miro, the shapes aren't structured so you're drawing boxes freehand. AI generation skips the manual construction entirely. You describe the architecture in text, the AI outputs valid XML with correct icons, connections, and grid-aligned layout. The architecture warnings in Diagrams.so add value that none of the three tools provide natively. Draw.io, Lucidchart, and Miro are all passive canvases. They render what you draw without questioning whether it's a good architecture. Diagrams.so actively checks for single-AZ deployments, public endpoints without WAF, databases without replicas, missing security boundaries, and ambiguous components. These checks happen at generation time, before the diagram enters your documentation. The practical workflow for most teams is: generate with Diagrams.so for the initial diagram, export as .drawio, refine in Draw.io desktop or VS Code for fine-tuning, store in Git for version control. If your team uses Lucidchart, import the .drawio file and continue editing there. The generation step saves 30 to 60 minutes of initial diagram construction, and the .drawio format ensures you're not locked into any single tool for the editing phase.
Related diagrams from the gallery


Try these diagram generators
Make Any Diagram from Text with AI
Describe your system, process, or data flow in plain English. Get a valid Draw.io diagram with correct symbols, aligned nodes, and exportable .drawio XML.
Generate Diagrams with AI, Not Drag-and-Drop
Write what your system does. The AI picks the notation, selects vendor icons, enforces grid alignment, and outputs valid mxGraphModel XML you can open in Draw.io.
Build Architecture Diagrams from Text Descriptions
Describe your cloud infrastructure or system design. Get a Draw.io architecture diagram with official vendor icons, VPC boundaries, and architecture warnings.