Generate DevOps Diagrams from Text with AI
Describe your DevOps toolchain in plain English. Get a valid Draw.io diagram with correct tool icons, pipeline flows, and infrastructure relationships.
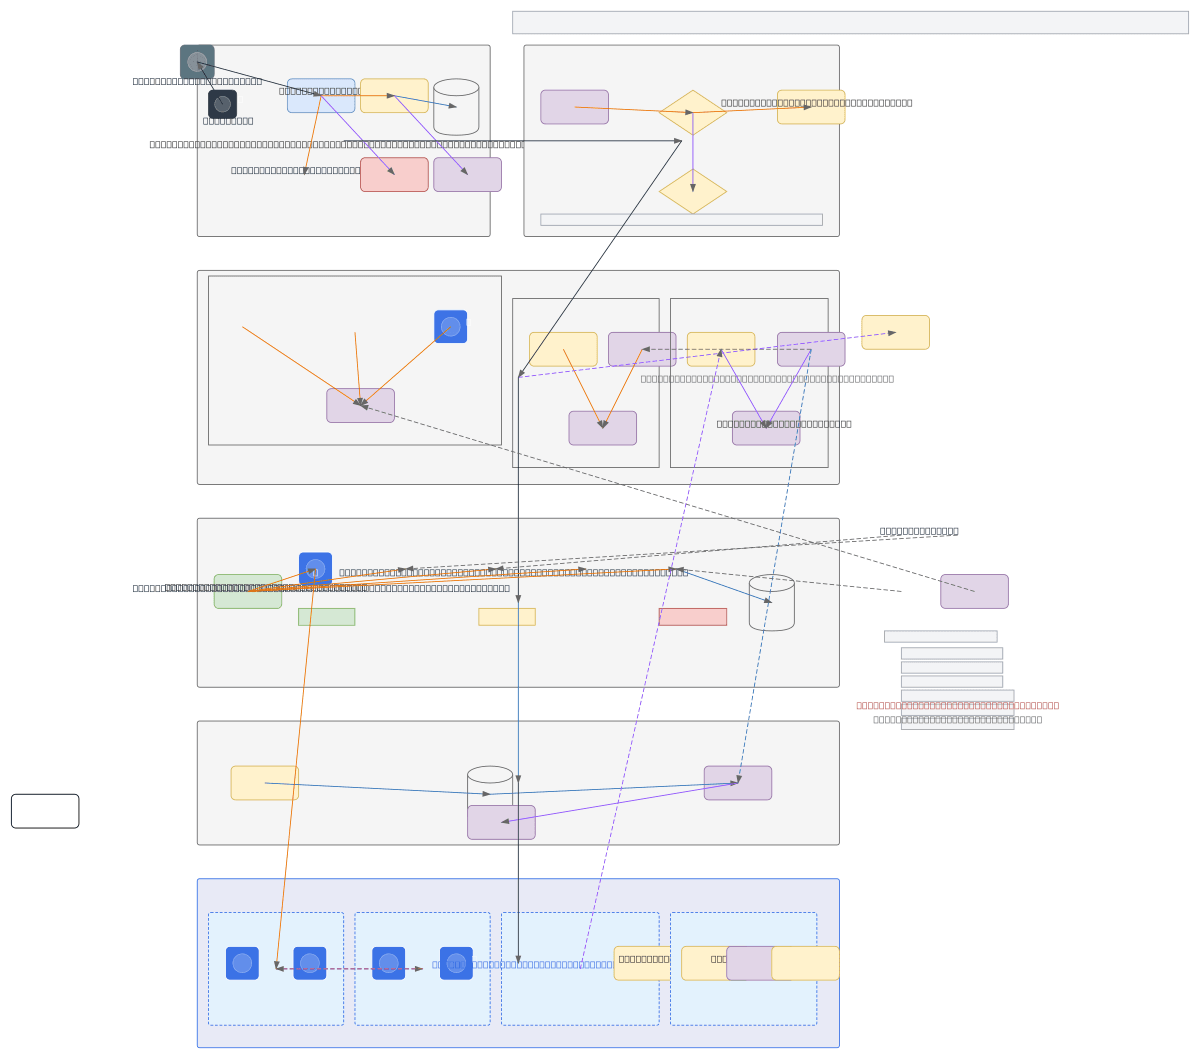
This AI DevOps diagram generator converts plain-text toolchain descriptions into Draw.io diagrams with correct icons for Terraform, Docker, Kubernetes, ArgoCD, Prometheus, Grafana, and Vault. Describe a platform where developers push to GitHub, Terraform provisions an EKS cluster with Karpenter node autoscaling, ArgoCD deploys Helm charts from a GitOps repo, Prometheus scrapes pod metrics exposed via OpenTelemetry Collector, and Grafana dashboards query Prometheus and Loki for unified observability. The AI maps each tool to its official icon from 30+ libraries and connects them with labeled relationship arrows. Every element snaps to a 10px grid. Architecture warnings flag single-AZ clusters (WARN-01) and databases without replicas (WARN-03). The output is native .drawio XML.
What Is an AI DevOps Diagram Generator?
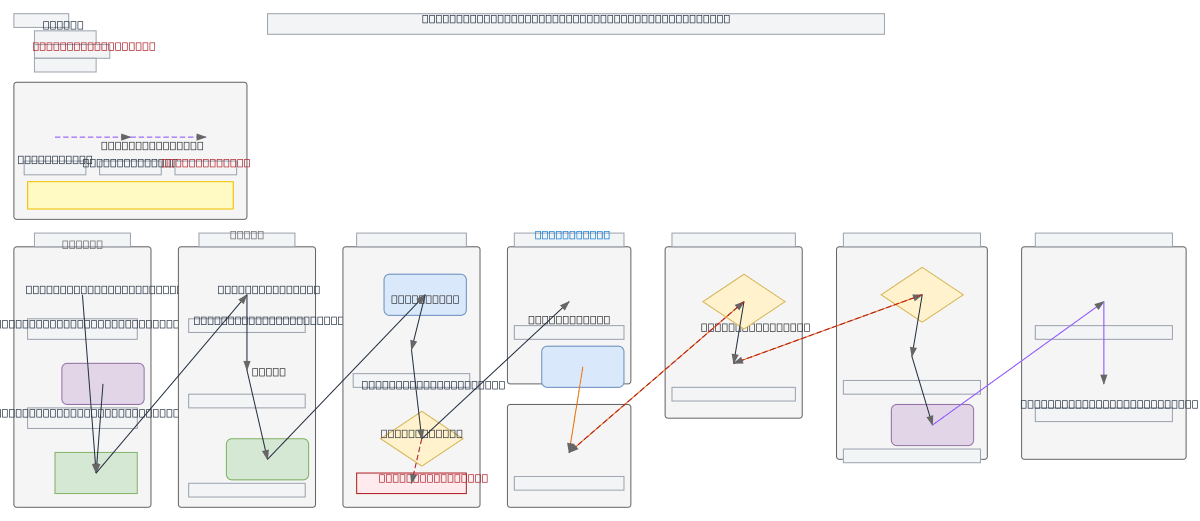
A DevOps diagram visualizes the full toolchain from source control through infrastructure provisioning, deployment, monitoring, and incident response. These diagrams typically include 10 to 30 distinct tools, each with specific integration points. Drawing one manually means finding icons for Terraform, Docker, Kubernetes, ArgoCD, Vault, Prometheus, Grafana, Loki, Jenkins, and more, then connecting them in a layout that communicates actual data flow. That takes hours. An AI DevOps diagram generator does it in seconds. You describe your toolchain in natural language. The AI identifies each tool, selects the correct icon from the matching library, and produces a diagram showing how they integrate. Diagrams.so handles the full DevOps lifecycle. Describe 'Terraform provisions VPC and EKS in us-east-1' and the diagram shows Terraform with an arrow to AWS VPC and EKS icons. Mention 'Vault injects secrets via sidecar injector into Kubernetes pods' and you see Vault connected to an injector sidecar within a pod boundary. The AI groups tools by lifecycle phase: source, build, deploy, operate, and monitor. RULE-06 governs automatic grouping into labeled containers. Opinionated mode enforces left-to-right flow from source to monitoring per RULE-05. VLM visual validation catches overlapping tool icons and tangled connectors between phases. Architecture warnings cover operational risks: WARN-01 for single-AZ infrastructure, WARN-02 for monitoring endpoints exposed without WAF protection, WARN-03 for databases deployed without read replicas. The output is native .drawio XML. Export to PNG or SVG for slide decks, or commit the XML to your infrastructure-as-code repository.
Key components
- Source control nodes: GitHub, GitLab, Bitbucket with webhook trigger arrows
- Infrastructure-as-Code tools: Terraform, Pulumi, CloudFormation with resource provisioning arrows
- Container runtime: Docker build stages, image registries (ECR, GCR, ACR, Docker Hub)
- Orchestration: Kubernetes clusters with namespace boundaries, ArgoCD/Flux GitOps controllers
- Secret management: HashiCorp Vault, AWS Secrets Manager, sidecar injector flows
- Observability stack: Prometheus, Grafana, Loki, Jaeger, OpenTelemetry Collector pipeline
- Lifecycle phase grouping: source, build, test, deploy, operate, monitor containers per RULE-06
- Architecture warnings for single-AZ (WARN-01), missing WAF (WARN-02), and no replicas (WARN-03)
How to generate with AI
- 1
Describe your DevOps toolchain
Write your end-to-end toolchain in plain English. Name every tool and describe how they connect. For example: 'Developers push to GitHub. GitHub Actions runs lint, test, and Docker build. Images push to ECR with commit SHA tags. Terraform provisions a VPC, EKS cluster, and RDS PostgreSQL in us-east-1. ArgoCD watches the deploy repo and syncs Helm charts to EKS. Vault runs as a Helm chart in EKS and injects database credentials via sidecar. Prometheus scrapes pod metrics via ServiceMonitor CRDs. Grafana queries Prometheus for dashboards and Loki for log aggregation. PagerDuty receives alerts from Alertmanager.'
- 2
Select DevOps type and provider
Choose 'DevOps' as the diagram type. Select your primary cloud provider (AWS, GCP, Azure) to load vendor-specific icons. The AI uses native icons for EKS, GKE, AKS, ECR, GCR, ACR, and other provider services. Generic DevOps tool icons load from the Kubernetes and Docker libraries in the 30+ available sets. Enable opinionated mode for strict left-to-right lifecycle flow.
- 3
Generate and review
Click generate. The AI outputs a .drawio XML with tools grouped by lifecycle phase, connected with labeled arrows showing data and configuration flow. VLM visual validation flags icon overlaps and tangled connectors. Architecture warnings identify infrastructure risks: single-AZ deployments (WARN-01), exposed endpoints (WARN-02), databases without replicas (WARN-03). Download as .drawio for editing in Draw.io, or export to PNG or SVG for presentations.
Example prompt
DevOps toolchain diagram for a fintech platform on AWS: developers push to GitHub Enterprise. GitHub Actions runs ESLint, pytest, SAST scan with Semgrep, and Docker build in parallel. Images push to ECR. Terraform Cloud provisions VPC with public/private subnets, NAT gateway, EKS cluster with Karpenter autoscaler, RDS Aurora PostgreSQL Multi-AZ, ElastiCache Redis cluster, and S3 buckets. ArgoCD in EKS watches the gitops-deploy repo and syncs Helm charts with wave-based ordering. HashiCorp Vault runs in EKS via Helm, injects database credentials and API keys via sidecar injector. OpenTelemetry Collector receives traces from application pods and exports to Jaeger. Prometheus scrapes metrics via ServiceMonitor CRDs. Grafana queries Prometheus for dashboards and Loki for centralized logs. Alertmanager routes critical alerts to PagerDuty on-call schedule. Show lifecycle phases: source, build, provision, deploy, operate, observe.
Example diagrams from the gallery


DevOps Toolchain Diagram vs Infrastructure Diagram vs Monitoring Stack Diagram
These three diagram types cover different slices of the DevOps landscape. Toolchain diagrams show the end-to-end tool pipeline from code to production. Infrastructure diagrams focus on the provisioned resources and networking. Monitoring stack diagrams detail the observability pipeline from metric collection to alerting.
| Feature | DevOps Toolchain Diagram | Infrastructure Diagram | Monitoring Stack Diagram |
|---|---|---|---|
| Primary scope | End-to-end tool pipeline: source control through build, deploy, and monitoring tools | Provisioned resources: VPCs, subnets, compute instances, databases, load balancers, DNS | Observability pipeline: metric collection, log aggregation, tracing, alerting, dashboards |
| Key elements | Tool icons (Terraform, ArgoCD, Vault, Prometheus), lifecycle phases, integration arrows | Network topology, CIDR blocks, security groups, compute nodes, managed services | Collectors, exporters, time-series databases, log stores, alert routing, dashboard endpoints |
| Abstraction level | Tool-level; shows which tools handle each lifecycle phase without internal resource details | Resource-level; shows every VPC, subnet, security group, and instance with configurations | Pipeline-level; shows data flow from instrumented apps through collectors to visualization |
| Change frequency | Updates when the team adopts or replaces tools, typically quarterly or less | Updates with every Terraform apply that adds or modifies resources | Updates when alert rules, dashboards, or collector configurations change |
| Primary audience | Engineering leadership, new team onboarding, vendor evaluations, platform strategy | Cloud architects, security auditors, compliance reviewers, capacity planners | SRE teams, on-call engineers, observability platform owners |
When to use this pattern
Use a DevOps toolchain diagram when onboarding new engineers who need to understand the full pipeline from commit to production. It's the right choice for engineering leadership presentations comparing current-state tooling against a proposed migration. Platform teams use these diagrams during tool evaluation phases to visualize how a new tool (like replacing Jenkins with GitHub Actions, or adding Sigstore for artifact signing) fits into the existing chain. If you need to document the actual provisioned infrastructure with VPC CIDR blocks and security groups, an infrastructure diagram is more appropriate. If the focus is strictly on how metrics, logs, and traces flow from applications to dashboards and alerts, use a monitoring stack diagram.
Frequently asked questions
What DevOps tools does the AI DevOps diagram generator recognize?
This AI DevOps diagram generator recognizes Terraform, Pulumi, CloudFormation, Docker, Kubernetes, ArgoCD, Flux, Helm, Kustomize, GitHub Actions, GitLab CI, Jenkins, HashiCorp Vault, Prometheus, Grafana, Loki, Jaeger, OpenTelemetry, PagerDuty, and many more. Each tool renders with its official icon from the 30+ available icon libraries.
How does the AI group tools in the diagram?
The AI organizes tools into lifecycle phase containers: source, build, test, deploy, operate, and observe. RULE-06 governs automatic grouping into labeled containers. Each phase gets a distinct background color and header label. Integration arrows cross phase boundaries to show how tools connect, like ECR images flowing from build to deploy.
Can I diagram multi-cloud DevOps setups?
Yes. Mention multiple cloud providers in your prompt and the AI loads icons from each library. For example, 'Terraform provisions AWS EKS and GCP Cloud SQL' renders with both AWS and GCP icons. Cross-cloud integration arrows show data flow between providers. The diagram clearly separates provider-specific resources into distinct regions.
Does the diagram show secret management flows?
Yes. Describe how secrets reach applications, like 'Vault injects PostgreSQL credentials via Kubernetes sidecar injector.' The AI draws Vault connected to the sidecar injector component within a pod boundary, with arrows labeled with the secret type. WARN-04 triggers if secrets cross trust boundaries without encryption.
Can I include the observability stack in the same diagram?
Yes. Describe monitoring tools alongside deployment tools and the AI includes both in the same diagram. Prometheus, Grafana, Loki, Jaeger, and OpenTelemetry Collector appear in the observe phase container with scrape and query arrows connecting them to the application pods in the deploy phase.
Related diagram generators
Generate CI/CD Pipeline Diagrams from Text with AI
Describe your build, test, and deploy stages in plain English. Get a valid Draw.io pipeline diagram with parallel jobs, approval gates, and rollback paths.
Generate Kubernetes Diagrams from Text with AI
Describe your Kubernetes cluster in plain English. Get a valid Draw.io diagram with CNCF icons, namespace boundaries, deployments, services, and ingress controllers.
Generate AWS architecture diagrams from text
Describe your AWS infrastructure in plain English. Get a valid Draw.io diagram with official AWS icons, VPC boundaries, and Multi-AZ placement.
Generate Security Architecture Diagrams from Text with AI
Describe your trust boundaries, encryption layers, and access controls in plain English. Get a valid Draw.io security diagram with defense-in-depth zones.