How to Create GCP Architecture Diagrams with AI
Google Cloud uses a project-based resource hierarchy and a networking model that differs significantly from AWS and Azure. This tutorial covers how to diagram GCP architectures correctly with actual prompts for Shared VPC, GKE Autopilot, BigQuery data pipelines, and Cloud Run serverless patterns.
GCP icon library and diagram conventions every architect should follow
Google publishes an official set of Google Cloud architecture icons as SVG files, organized by product area. Unlike AWS icons which use a consistent orange-and-white palette, GCP icons use product-specific colors: blue for compute, green for networking, red for management tools, purple for data analytics. Each icon follows Google's Material Design principles with rounded corners and consistent stroke widths. Diagrams.so includes the full GCP icon library. When you select Google Cloud as your cloud provider, the AI matches service names to official icons following RULE-02. Write "Cloud Spanner" and you get the Spanner icon with its globe symbol. Write "Pub/Sub" and you get the messaging icon with the distinctive topic and subscription visual. GCP diagrams have conventions that differ from AWS and Azure. The primary organizational boundary in GCP is the project, not the VPC or subscription. Every resource belongs to a project, and projects belong to folders in the resource hierarchy. Your diagrams should show this hierarchy when it matters for understanding access control and billing. For network diagrams, the VPC is the boundary. For governance diagrams, the org/folder/project tree is the boundary. Google's architecture center publishes reference architectures that follow a consistent visual style: left-to-right data flow, blue boundary boxes for projects and VPCs, service icons at actual size (not stretched), and labeled arrows showing protocols or data types. Diagrams.so follows this same layout convention with RULE-05 enforcing left-to-right flow. One GCP-specific convention worth noting: Google uses "zones" differently than AWS uses "availability zones." A GCP zone is a deployment area within a region (us-central1-a, us-central1-b), and some services are zonal while others are regional or multi-regional. Your diagrams should indicate whether a resource is zonal or regional, because that directly affects your availability story. Cloud SQL with a zonal instance is single-zone. Cloud SQL with regional HA is multi-zone. The icon is the same; the deployment boundary changes.
Diagramming GCP projects and Shared VPC for multi-team environments
Shared VPC is GCP's answer to centralized network management across multiple teams. The host project owns the VPC and subnets. Service projects attach to the host project and deploy resources into those shared subnets. Diagramming this correctly means showing the project boundaries, the Shared VPC relationship, and which subnets each service project can access. Here's a prompt for a Shared VPC architecture: "GCP Shared VPC architecture with organization hierarchy. Host project named 'network-host' contains a Shared VPC with three subnets: web-subnet (10.0.1.0/24) in us-central1, app-subnet (10.0.2.0/24) in us-central1, and data-subnet (10.0.3.0/24) in us-central1. Three service projects: 'frontend-prod' has access to web-subnet and runs a Cloud Load Balancer with managed SSL certificate forwarding to a Managed Instance Group. 'backend-prod' has access to app-subnet and runs GKE Autopilot cluster with three namespaces. 'data-prod' has access to data-subnet and runs Cloud SQL PostgreSQL with private IP and Memorystore Redis. Cloud NAT in the host project provides egress for all private subnets. Cloud Armor WAF policy attached to the Cloud Load Balancer. VPC Flow Logs enabled on all subnets with logs flowing to BigQuery in a separate 'logging' project." The generated diagram shows the organization at the top with the host project as a large boundary containing the VPC and its three subnets. Each service project appears as a separate boundary with a dashed-line connection to the host project indicating the Shared VPC attachment. Resources within each service project sit inside their respective subnets, visually crossing the project boundary to show the shared network relationship. Cloud NAT sits at the VPC boundary edge. VPC Flow Logs arrows point from each subnet down to BigQuery in the logging project. This diagram structure is critical for GCP environments because IAM permissions, billing, and network connectivity all follow the project boundary. A diagram that doesn't show project boundaries is essentially lying about the access control model. Reviewers at GCP-heavy organizations will ask "which project owns this?" for every resource, and the diagram should answer that without additional explanation. Diagrams.so architecture warnings add value here. WARN-04 fires if subnets lack firewall rule indicators. WARN-01 fires if compute resources only exist in a single zone within a region.
GKE Autopilot architecture: pods, node auto-provisioning, and Workload Identity
GKE Autopilot eliminates node management by letting Google provision and scale nodes based on pod requirements. Diagramming Autopilot differs from standard GKE because you don't show node pools, you show pod specifications and let the diagram communicate that Google manages the underlying infrastructure. Use this prompt for a GKE Autopilot architecture: "GKE Autopilot cluster architecture in us-central1. Cluster runs in a dedicated VPC subnet with alias IP ranges for pod and service CIDRs. Three workloads: web-frontend Deployment (3 replicas, 512Mi memory, 250m CPU per pod) exposed via Kubernetes Gateway API with a global external Application Load Balancer and Google-managed TLS certificate. order-service Deployment (5 replicas, 1Gi memory, 500m CPU) as ClusterIP service accessed only from web-frontend. payment-processor Deployment (2 replicas, 2Gi memory, 1 CPU) as ClusterIP service accessed only from order-service. Workload Identity Federation maps each Kubernetes service account to a Google Cloud IAM service account. web-frontend SA accesses Secret Manager. order-service SA accesses Cloud Firestore. payment-processor SA accesses Cloud HSM for encryption keys. Anthos Service Mesh enabled for mTLS between all services. Cloud Logging and Cloud Monitoring receive metrics and logs from all pods via GKE-managed collection agents. Network Policy enforces pod-to-pod communication restrictions." The generated diagram shows the GKE Autopilot cluster as a large boundary with "Managed by Google" notation on the node layer. Three Deployment groups appear inside, each with replica count labels. The Gateway API and Application Load Balancer sit at the cluster ingress on the left. Arrows flow left to right: ALB to web-frontend, web-frontend to order-service, order-service to payment-processor. Each service has a Workload Identity arrow pointing outside the cluster boundary to its respective Google Cloud service (Secret Manager, Firestore, Cloud HSM). Anthos Service Mesh is represented as mesh lines between the three services with mTLS labels. The Workload Identity connections are the most architecturally significant part of this diagram. They replace the old pattern of storing JSON key files in Kubernetes Secrets, which was a security anti-pattern. Showing Workload Identity Federation explicitly in the diagram communicates to reviewers that the cluster follows current GCP security best practices. WARN-02 would fire if the ALB lacked Cloud Armor, which is why a production prompt should include WAF policy details.
BigQuery data pipeline visualization: ingestion, transformation, and serving
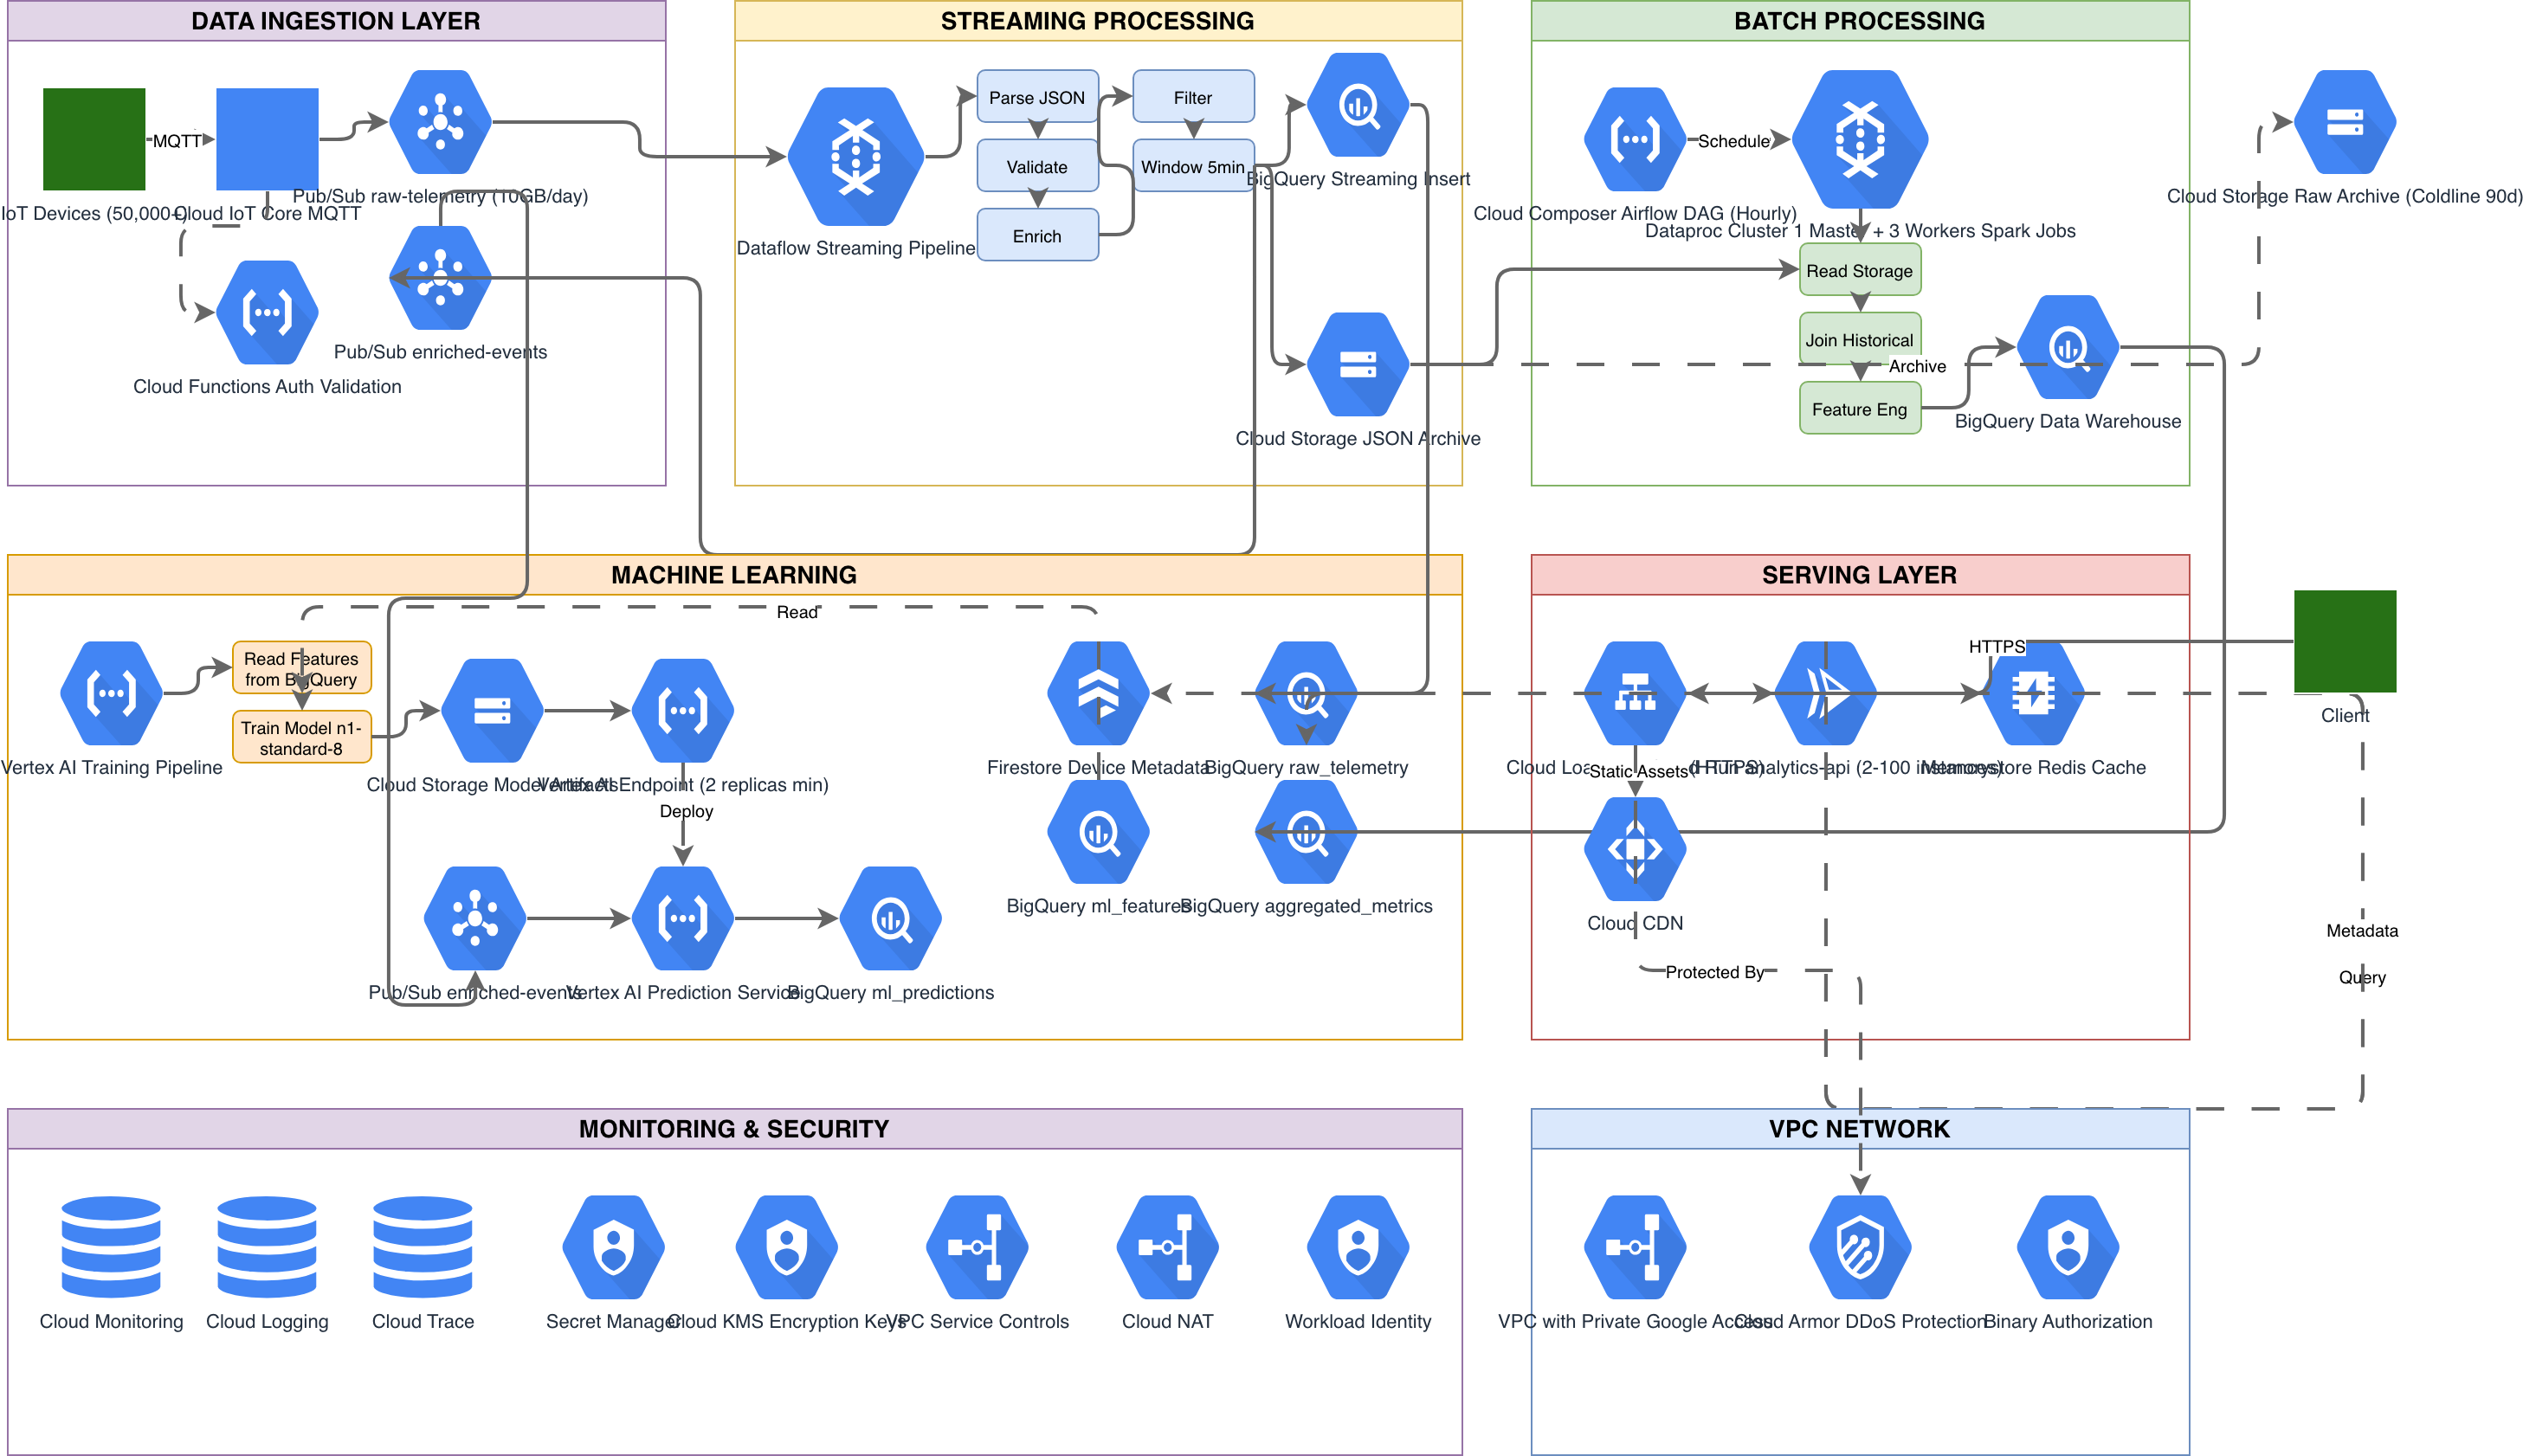
BigQuery sits at the center of most GCP data architectures, but a diagram that shows a single BigQuery icon with arrows pointing into it from every direction isn't useful. Data pipeline diagrams need to show the stages: raw ingestion, transformation (ELT or ETL), curated datasets, and downstream consumers. Each stage has distinct GCP services. Here's a prompt for a BigQuery-centric data pipeline: "GCP data analytics pipeline. Source systems: Cloud SQL PostgreSQL (transactional data), Pub/Sub topics receiving clickstream events from a web application, and Cloud Storage buckets receiving daily CSV uploads from a partner via SFTP transfer managed by Cloud Data Fusion. Dataflow streaming pipeline reads from Pub/Sub, applies windowed aggregations (5-minute tumbling windows), and writes to BigQuery streaming buffer in the 'raw' dataset. Dataflow batch pipeline runs daily to load Cloud SQL data via JDBC connector into BigQuery 'raw' dataset. Cloud Data Fusion orchestrates the partner CSV pipeline, cleaning and validating data before loading into BigQuery 'staged' dataset. dbt Cloud runs transformation models on a schedule, reading from 'raw' and 'staged' datasets and writing to 'curated' dataset with documented lineage. BigQuery materialized views in a 'serving' dataset power Looker dashboards. BigQuery ML models in the 'ml' dataset train on curated data and serve predictions via a Vertex AI endpoint. Data Catalog with policy tags enforces column-level security on PII fields. All pipelines log to Cloud Logging with error alerts to a Pub/Sub dead-letter topic monitored in Cloud Monitoring." The generated diagram flows left to right across five columns: Sources, Ingestion, Raw/Staged, Curated, and Consumers. Cloud SQL, Pub/Sub, and Cloud Storage appear on the left. Dataflow streaming and batch pipelines sit in the ingestion column with arrows showing the streaming and batch paths separately. BigQuery datasets appear as a stacked group in the center with raw, staged, curated, serving, and ml datasets as labeled partitions. dbt Cloud sits between raw/staged and curated with transformation arrows. On the right, Looker connects to the serving dataset and Vertex AI connects to the ml dataset. This visualization makes data lineage traceable. A reviewer can follow any data element from source to dashboard. The streaming path (Pub/Sub to Dataflow to BigQuery streaming buffer) is visually distinct from the batch path (Cloud SQL to Dataflow batch to BigQuery load). This distinction matters for latency SLA discussions. Data Catalog with policy tags appears as a governance overlay, showing that column-level security applies across all datasets.
GCP serverless architecture with Cloud Run: event-driven and request-driven patterns
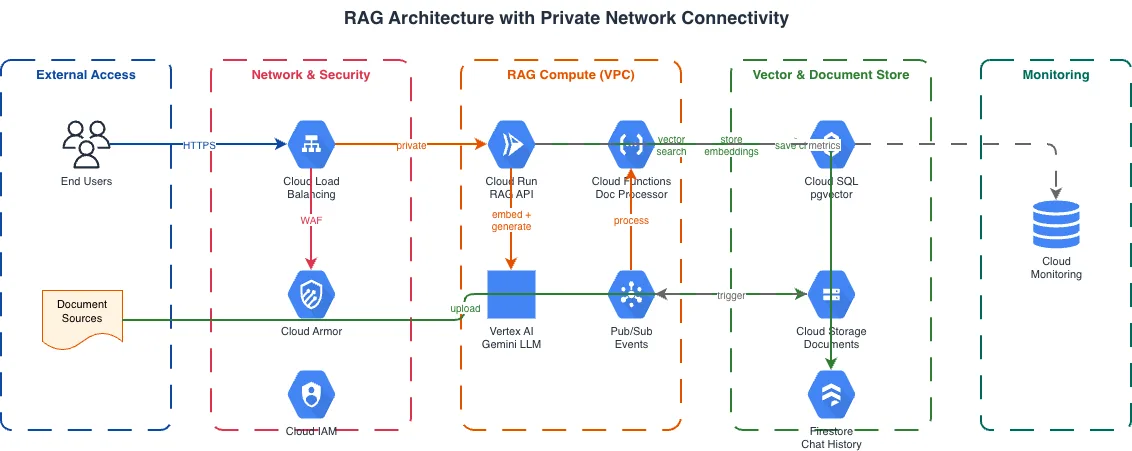
Cloud Run is GCP's container-as-a-service offering. It runs containers without infrastructure management, scales to zero, and supports both request-driven (HTTP) and event-driven (Pub/Sub, Eventarc) triggers. Diagramming Cloud Run architectures means showing the trigger type, the service configuration, and the downstream connections for each service. Use this prompt for a Cloud Run serverless architecture: "GCP serverless architecture with Cloud Run. Request-driven path: Cloud Load Balancer with Cloud Armor WAF policy routes HTTPS traffic to Cloud Run service 'api-gateway' (2 vCPU, 1Gi memory, max 100 instances, min 1 instance for cold start mitigation). api-gateway service calls two internal Cloud Run services via Cloud Run service-to-service authentication: 'user-service' and 'catalog-service', both with VPC connector accessing Cloud SQL PostgreSQL with private IP. Event-driven path: Cloud Storage upload event triggers Eventarc, which invokes Cloud Run service 'image-processor' (4 vCPU, 4Gi memory, max 20 instances, 300-second timeout). image-processor writes thumbnails back to a separate Cloud Storage output bucket and publishes a completion event to Pub/Sub. Pub/Sub triggers Cloud Run service 'notification-service' which sends emails via SendGrid API and writes audit records to Firestore. All services use Secret Manager for API keys and database credentials via Workload Identity. Cloud Trace enabled for distributed tracing across all services. Error Reporting collects unhandled exceptions." The generated diagram splits into two horizontal lanes: request-driven on top and event-driven on the bottom. The request path shows Cloud Load Balancer with Cloud Armor shield on the left, flowing to the api-gateway Cloud Run service, which fans out to user-service and catalog-service. Both connect through a VPC connector (shown as a gateway icon) to Cloud SQL. The event path shows Cloud Storage triggering Eventarc, which invokes image-processor, which writes to the output bucket and publishes to Pub/Sub, which triggers notification-service, which connects to SendGrid and Firestore. Secret Manager and Cloud Trace span both lanes as shared infrastructure, positioned at the bottom. This dual-lane layout is effective because it visually separates the synchronous request path from the asynchronous event path. Reviewers can immediately see which services handle user-facing latency and which operate in the background. The VPC connector detail matters. Cloud Run services are serverless and run outside your VPC by default. To reach Cloud SQL on a private IP, you need a VPC connector. Showing this in the diagram prevents the common review question: "How does this serverless service reach the database on a private network?" WARN-02 fires if the Cloud Load Balancer lacks Cloud Armor, and WARN-03 fires if Cloud SQL appears without a standby instance for HA.
Security and IAM visualization on GCP: beyond network firewalls
GCP's security model is IAM-centric. While VPC firewall rules handle network-level access control, the majority of access decisions happen at the IAM layer through roles, conditions, and Workload Identity. Diagramming GCP security means showing both layers and how they interact. Organization policies, IAM bindings, and VPC Service Controls form the three pillars of GCP security governance. Organization policies are constraints applied at the org, folder, or project level. They restrict things like which regions resources can be created in, whether public IP addresses are allowed, and whether external sharing is enabled. IAM bindings define who (or what) can access which resources with what permissions. VPC Service Controls create security perimeters around GCP projects to prevent data exfiltration, even by users with IAM access. For a security-focused GCP diagram, structure your prompt around these three pillars. Include the organization policy constraints that matter for your compliance requirements. Show IAM bindings as identity arrows from principals to resources, distinct from network arrows. Show VPC Service Controls as dashed perimeters around projects that handle sensitive data. A common prompt pattern: "GCP security architecture for healthcare workload. VPC Service Controls perimeter around three projects: patient-data, analytics, and ml-training. Access Context Manager policy requires corporate network origin and managed device for perimeter access. Inside the perimeter: Cloud Healthcare API in patient-data project with FHIR store. BigQuery in analytics project reading from FHIR store via authorized views. Vertex AI in ml-training reading de-identified datasets from BigQuery. Outside the perimeter: Cloud Identity for user authentication with 2-step verification enforced. Security Command Center Premium for threat detection and compliance monitoring. Binary Authorization enforcing signed container images for all GKE deployments inside the perimeter. Cloud Audit Logs from all projects streaming to a dedicated audit-logs project outside the perimeter with a CMEK-encrypted BigQuery dataset for log retention." The generated diagram shows the VPC Service Controls perimeter as a thick dashed boundary around the three projects. Inside, data flows from Cloud Healthcare API to BigQuery to Vertex AI. Access Context Manager appears as a gate at the perimeter boundary. Outside, Cloud Identity handles authentication with arrows crossing the perimeter. Security Command Center spans the entire architecture. Cloud Audit Logs flow from inside the perimeter to the dedicated logging project outside it. This diagram type is required for HIPAA, FedRAMP, and SOC 2 compliance reviews on GCP. The VPC Service Controls perimeter is GCP's strongest data exfiltration prevention mechanism, and making it visible in the architecture diagram demonstrates that the organization takes data boundary enforcement seriously.
Related diagrams from the gallery

Try these diagram generators
Generate GCP Architecture Diagrams from Text
Describe your Google Cloud infrastructure in plain English. Get a valid Draw.io diagram with official GCP icons, project boundaries, and VPC networking.
Generate GKE Architecture Diagrams from Text
Describe your Google Kubernetes Engine cluster in plain English. Get a valid Draw.io diagram with GKE Autopilot, Anthos Service Mesh, Gateway API, and Workload Identity Federation.
Generate GCP Data Analytics Diagrams from Text
Describe your Google Cloud data pipeline in plain English. Get a valid Draw.io diagram with BigQuery, Dataflow, Pub/Sub, and Looker components using official GCP icons.