How to Document Cloud Infrastructure: Diagrams, ADRs, and Runbooks
Cloud architecture documentation fails when it's treated as a one-time deliverable instead of a living system. This guide covers the three pillars that actually work: generated architecture diagrams, lightweight ADRs, and operational runbooks tied together with cross-references.
Why most cloud architecture documentation is outdated by Thursday
Cloud architecture documentation has a half-life of about three days. Someone deploys a new microservice on Monday. The architecture diagram still shows last month's topology on Friday. This isn't a discipline problem. It's a tooling and process problem. When updating a diagram takes 20 minutes of dragging shapes in a visual editor, documentation falls behind infrastructure changes at the speed of 'I'll update it later.' The root cause is that most teams treat documentation as separate from the development workflow. Infrastructure changes happen in Terraform pull requests. Architecture diagrams live in Confluence. Operational runbooks live in a wiki. Decision records live in Google Docs or don't exist at all. None of these are linked. None of them update automatically. The person who changed the infrastructure is rarely the person who updates the documentation, and the documentation owner doesn't know a change happened until something breaks. Cloud architecture documentation works when it follows three principles. First, the documentation lives next to the code it describes. A .drawio file in the same Git repository as the Terraform modules means diagram updates can be part of the same pull request as infrastructure changes. Second, the documentation is fast to update. AI-generated diagrams from text descriptions take 10 seconds instead of 20 minutes. When the update cost is low, it actually happens. Third, the documentation has explicit cross-references between artifacts. The architecture diagram references the ADR that explains why you chose Aurora over DynamoDB. The runbook references the diagram that shows the failover path. These cross-references turn disconnected documents into a navigable system. The rest of this article covers the three pillars of cloud architecture documentation that actually survives contact with reality: architecture diagrams, Architecture Decision Records (ADRs), and operational runbooks.
The three pillars: diagrams answer 'what', ADRs answer 'why', runbooks answer 'how'
Each pillar serves a different audience at a different time. Architecture diagrams answer "what does the system look like right now." They're consumed during onboarding, design reviews, and incident triage. ADRs answer "why did we make this choice instead of that one." They're consumed when someone proposes a change and needs to understand the reasoning behind the current state. Runbooks answer "how do I operate this system." They're consumed during incidents, deployments, and capacity changes. You need all three because each one fails alone. Diagrams without ADRs show you the system but not why it's shaped that way. The diagram shows Aurora PostgreSQL, but it doesn't explain why you chose Aurora over RDS PostgreSQL or DynamoDB. When someone proposes migrating to DynamoDB, the diagram can't defend itself. ADRs without diagrams explain decisions in text but don't show how those decisions manifest in the actual architecture. An ADR saying "we chose event-driven architecture for order processing" doesn't show the EventBridge rules, SQS queues, and Lambda functions that implement it. Runbooks without diagrams or ADRs give you step-by-step procedures without context. A runbook saying "scale the ECS service to 10 tasks" doesn't show what other services are affected by that scaling action. The investment per pillar is different. Diagrams are high effort to create manually, low effort to create with AI generation, and medium effort to maintain. ADRs are low effort to create (a few paragraphs when the decision is fresh) and zero effort to maintain (they're immutable records). Runbooks are medium effort to create and high effort to maintain because operational procedures change with every infrastructure update. The tooling for each pillar is different too. Diagrams need a visual editor or an AI generator that outputs .drawio XML. ADRs need a text file in a Git repository (Markdown works fine). Runbooks need a structured format that supports step-by-step procedures, code blocks for commands, and links to monitoring dashboards.
Create architecture diagrams that stay current using AI generation prompts
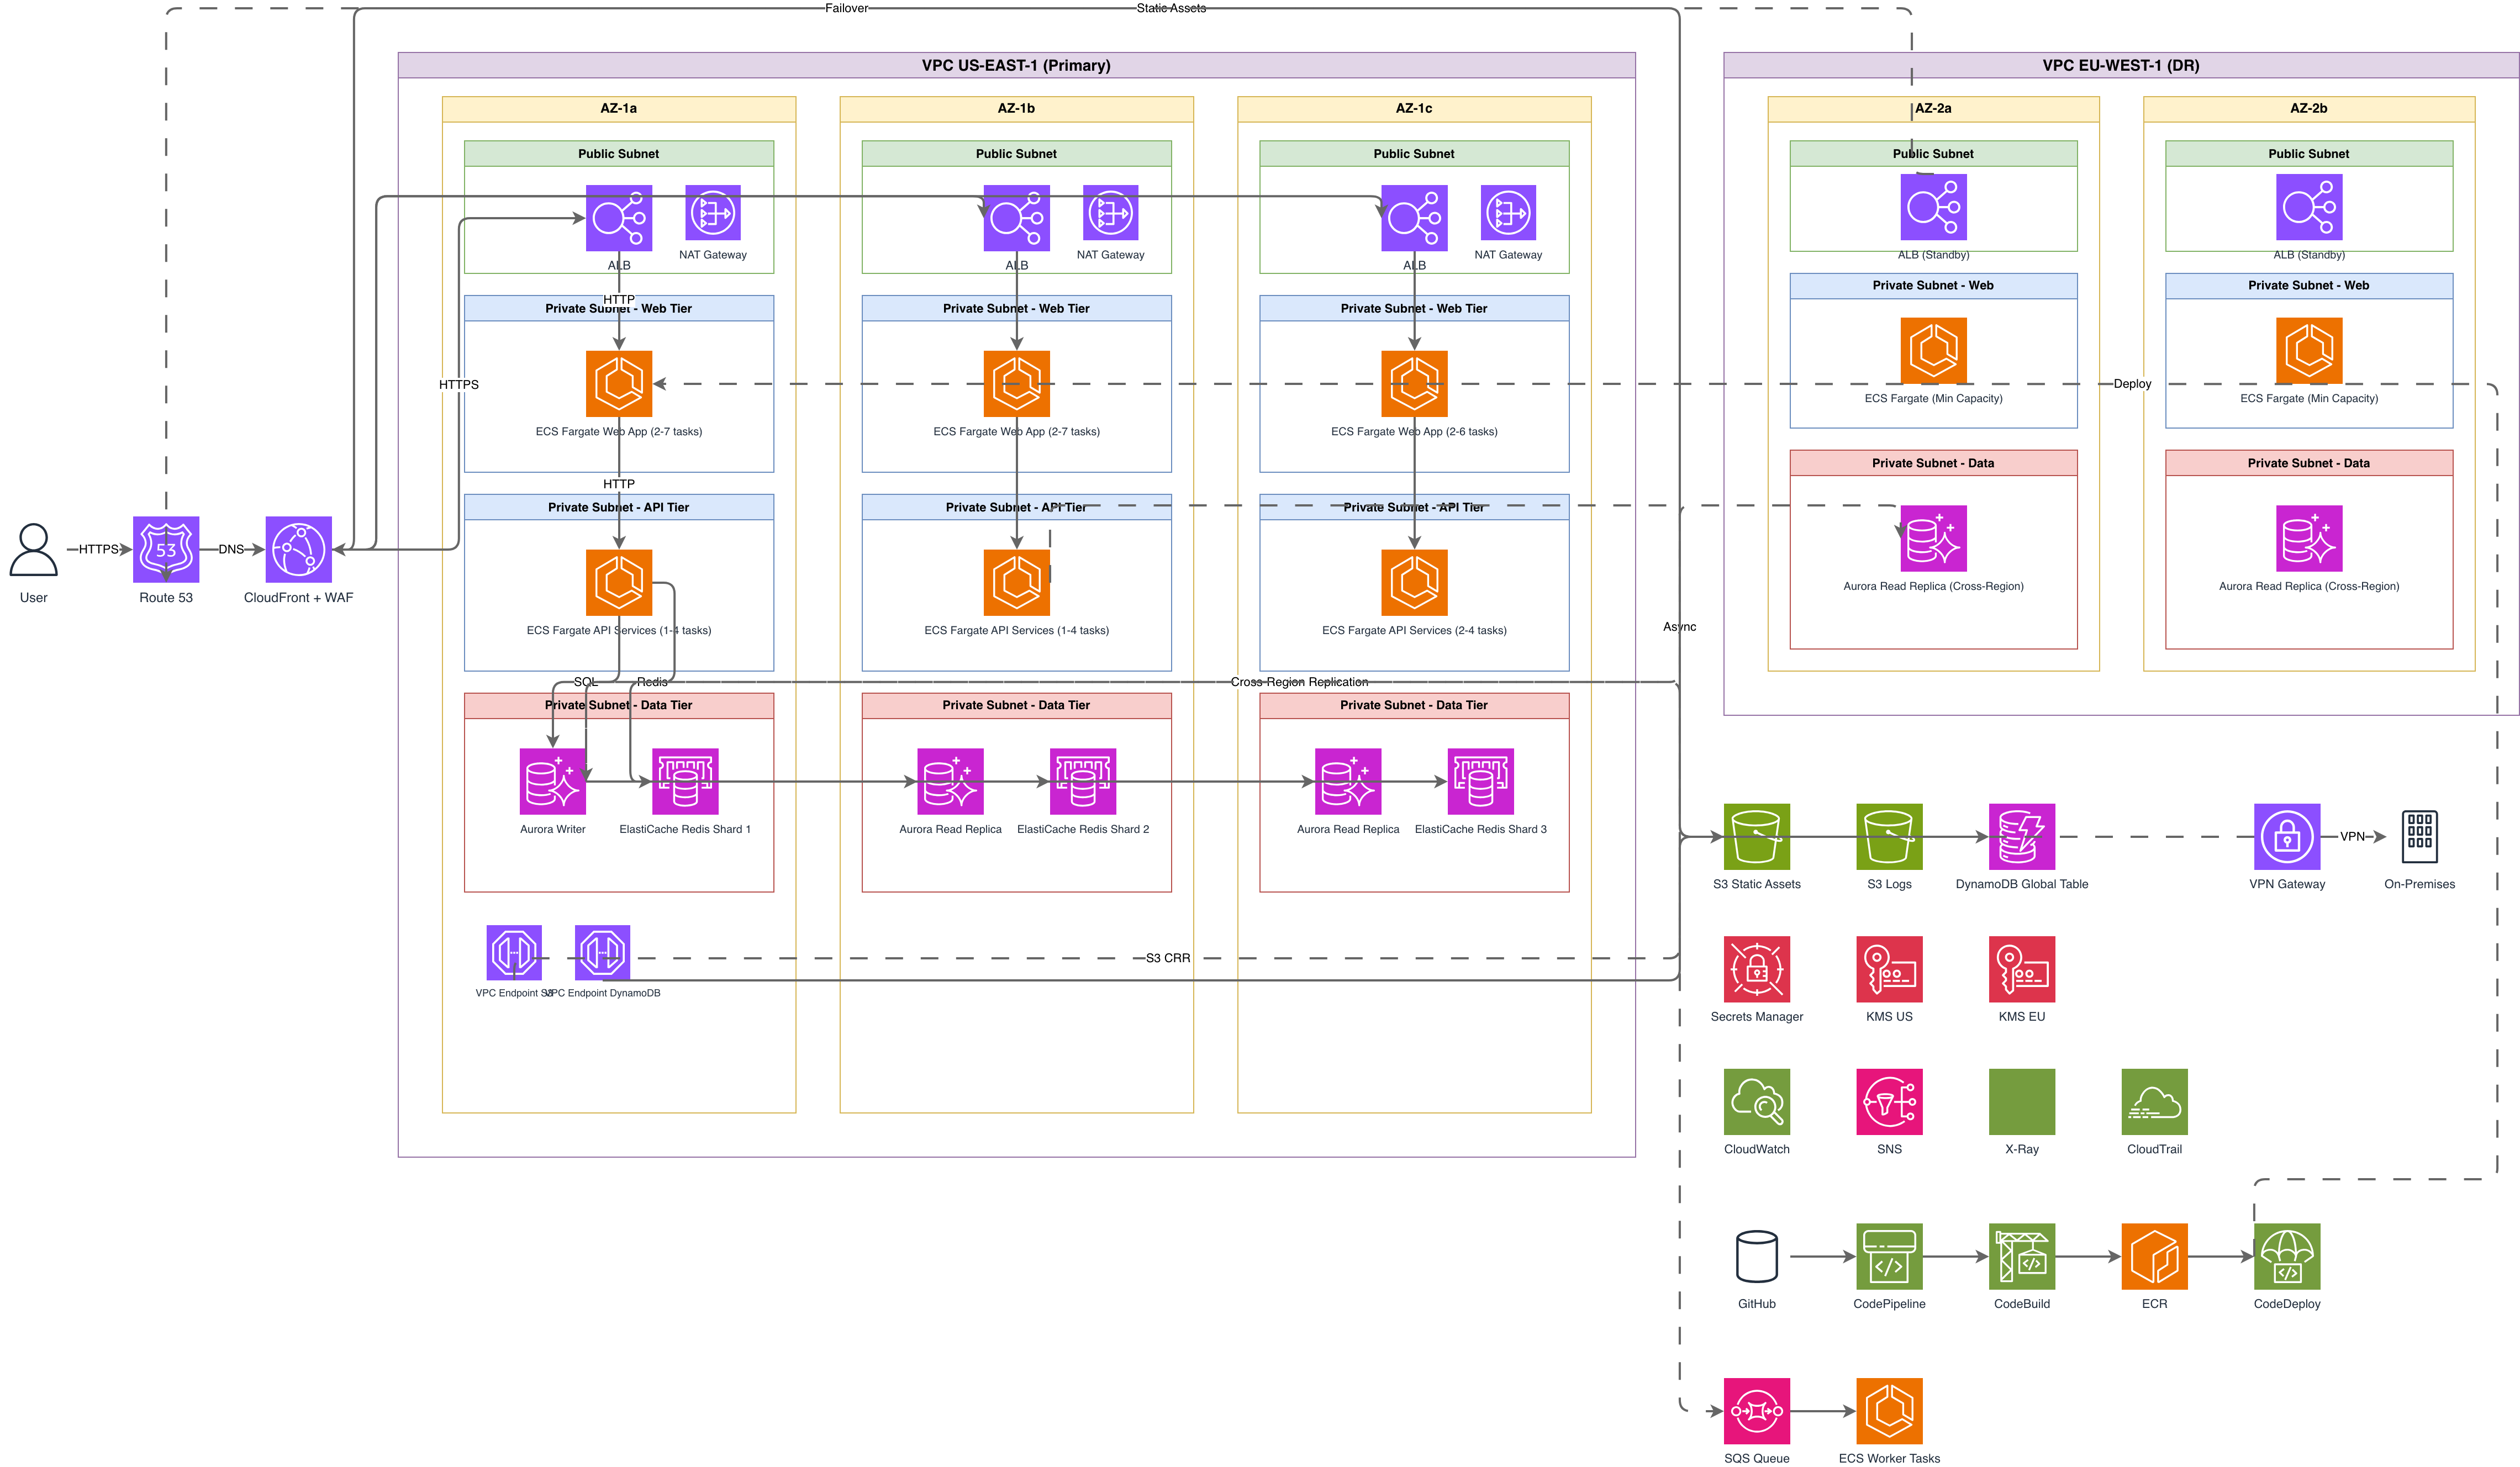
The fastest path to a current architecture diagram is describing your running infrastructure in text and generating the diagram from that description. This inverts the traditional workflow. Instead of manually drawing a diagram and hoping it matches reality, you describe reality and let the AI handle layout and visualization. Here's a prompt that generates a production architecture diagram from an infrastructure description: "Production environment for the order-processing service. AWS us-east-1. CloudFront distribution with WAF v2 for rate limiting and SQL injection protection. Application Load Balancer in public subnets across us-east-1a and us-east-1b. Six ECS Fargate tasks running the order-api container image behind the ALB in private subnets. Tasks read from Aurora PostgreSQL cluster with one writer and two read replicas in private DB subnet group. Order events published to EventBridge custom event bus. Three EventBridge rules: route OrderCreated events to SQS queue for fulfillment-service, route PaymentFailed events to SNS topic for notifications, route all events to Kinesis Data Firehose for analytics pipeline to S3. ElastiCache Redis 7 cluster in private subnet for session caching and rate limit counters. CloudWatch alarms on ALB 5xx rate, ECS CPU utilization, Aurora replication lag, and SQS queue depth." This prompt generates a diagram with the complete architecture in about 15 seconds. The diagram shows the CloudFront to WAF to ALB chain, six Fargate tasks in two AZ groups, Aurora with labeled writer and replicas, the EventBridge fan-out pattern with three rules, ElastiCache between the API and database layers, and CloudWatch as a monitoring overlay. All connections are labeled. To keep this diagram current, store the description as a text file alongside the .drawio file in your repository. When the infrastructure changes (say you add a seventh Fargate task and a third AZ), update the text description and regenerate. The AI handles relayout, icon updates, and connection adjustments. The .drawio export from Diagrams.so means the new diagram opens in the same tools your team already uses. For teams with infrastructure-as-code, the text description can be derived from Terraform outputs or CloudFormation stack descriptions. A CI job that extracts resource descriptions from your IaC and regenerates diagrams weekly ensures documentation never drifts more than seven days from reality.
Write Architecture Decision Records: template and real example
An Architecture Decision Record captures a single decision, the context that motivated it, the options considered, and the consequences of the choice. ADRs are immutable. You don't edit an old ADR when circumstances change. You write a new ADR that supersedes it and reference the old one. This immutability creates an audit trail of architectural evolution. The template has five sections. Title: a short noun phrase like "Use Aurora PostgreSQL for order data." Status: Proposed, Accepted, Deprecated, or Superseded. Context: what's happening that requires a decision (2-3 paragraphs). Decision: what you chose and why (1-2 paragraphs). Consequences: what follows from this decision, both positive and negative (bulleted list). Here's a real example: Title: ADR-0012: Use EventBridge for inter-service communication. Status: Accepted. Context: The order-processing service needs to notify the fulfillment-service when an order is created and the notification-service when a payment fails. The current implementation uses direct HTTP calls between services, which creates tight coupling and makes the caller responsible for retry logic. We evaluated three options: direct HTTP calls with circuit breakers, SQS point-to-point queues, and EventBridge with routing rules. Decision: Use Amazon EventBridge with a custom event bus. EventBridge provides content-based routing through rules, which lets us add new consumers without modifying the producer. The schema registry provides contract enforcement. The archive and replay feature supports debugging and reprocessing. SQS was rejected because point-to-point queues require the producer to know about every consumer. Direct HTTP was rejected because it couples service availability. Consequences: Positive: new consumers can subscribe to events without code changes in the producer. Event replay enables debugging production issues. Schema registry enforces API contracts. Negative: EventBridge adds 50-100ms latency compared to direct HTTP. Eventually consistent delivery requires idempotent consumers. CloudWatch monitoring is less intuitive than HTTP error codes. Store ADRs as numbered Markdown files in a docs/adr/ directory in the same repository as the service they describe. Reference the ADR number in the architecture diagram as a label on the relevant component: the EventBridge icon in the diagram gets a label "See ADR-0012" so anyone viewing the diagram can find the rationale.
Build operational runbooks for incidents, scaling, and deployments
A runbook is a step-by-step procedure for operating a system. Good runbooks are written during calm times and consumed during panicked times. That means they need to be concise, command-first, and free of explanatory preamble. An on-call engineer at 3 AM doesn't need context paragraphs. They need numbered steps with copy-paste commands. Structure every runbook with five sections. Trigger: what situation causes you to use this runbook (example: "CloudWatch alarm ALB-5xx-rate fires when 5xx responses exceed 5% for 3 consecutive minutes"). Prerequisites: access, tools, and permissions needed before starting. Steps: numbered commands with expected outputs. Validation: how to confirm the issue is resolved. Escalation: who to contact if the runbook doesn't fix the problem. Here's a skeleton for a scaling runbook: Trigger: ECS CPU utilization exceeds 80% sustained for 10 minutes, or SQS queue depth exceeds 10,000 messages. Prerequisites: AWS CLI configured with production profile, kubectl access to the EKS cluster, Datadog dashboard open. Step 1: Check current ECS task count with 'aws ecs describe-services' and verify desired vs running task count. Step 2: If running count is less than desired count, tasks are failing to start. Check CloudWatch logs for OOM or health check failures. Step 3: If running count equals desired count and CPU is still high, increase desired count by 50% with 'aws ecs update-service --desired-count N'. Step 4: Monitor ALB target group healthy host count until new tasks register. Step 5: Monitor CPU utilization for 10 minutes. If still above 80%, repeat Step 3. Validation: CPU utilization below 60% for 10 minutes, SQS queue depth trending toward zero, no 5xx errors in ALB access logs. Escalation: If three scaling rounds don't reduce CPU below 80%, page the team lead to investigate application-level performance issues. Link the runbook to the architecture diagram by including a diagram reference at the top: "This runbook operates on the order-processing ECS cluster shown in docs/diagrams/order-processing-architecture.drawio, specifically the Fargate tasks behind the internal ALB." This cross-reference lets the on-call engineer see the blast radius of their actions. Scaling the ECS service affects the ALB target group registration, Aurora connection count, and ElastiCache connection count. The diagram shows all of these relationships.
Connect diagrams to ADRs and runbooks with cross-referencing
Cross-referencing turns three separate document types into a navigable knowledge system. Without cross-references, an engineer finds the architecture diagram but not the ADR explaining why EventBridge was chosen. They find the runbook but not the diagram showing what other services are affected by a scaling action. Cross-referencing closes these gaps. Implement cross-references at three levels. First, in the diagram itself. Add labels to components that reference ADR numbers: the EventBridge icon gets "ADR-0012" as a sublabel. The Aurora cluster gets "ADR-0008: Aurora over DynamoDB" as a sublabel. In Draw.io, you can add hyperlinks to shapes that open the ADR file directly. When you generate diagrams with Diagrams.so, include the ADR references in your prompt: "EventBridge custom event bus (see ADR-0012)" and the label appears in the generated diagram. Second, in the ADR. Add a "Related Artifacts" section at the bottom of every ADR listing the diagram files and runbooks that are affected by this decision. ADR-0012 would list: "Diagram: docs/diagrams/order-processing-architecture.drawio (EventBridge section). Runbooks: docs/runbooks/event-replay.md, docs/runbooks/dead-letter-queue.md." When someone reads the ADR, they can immediately navigate to the visual representation and the operational procedures. Third, in the runbook. Every runbook should open with a reference to the architecture diagram and the relevant ADRs. "This runbook covers incident response for the event processing pipeline. See docs/diagrams/order-processing-architecture.drawio for the full architecture. Key decisions: ADR-0012 (EventBridge), ADR-0015 (Dead letter queue strategy)." This gives the on-call engineer architectural context before they start executing commands. Use a consistent naming convention to make cross-references predictable. Diagrams go in docs/diagrams/ with descriptive filenames. ADRs go in docs/adr/ with sequential numbering. Runbooks go in docs/runbooks/ with trigger-based naming. When every artifact follows a predictable pattern, engineers can find what they need without searching.
Tools and workflows for keeping documentation alive beyond the first week
Documentation dies when updating it is a separate task from changing infrastructure. The solution is to embed documentation updates into existing workflows so they happen automatically or with minimal additional effort. Workflow 1: Diagram regeneration in CI. Add a GitHub Actions job that regenerates architecture diagrams from text descriptions stored in your repository. When someone updates the infrastructure description file (a plain text prompt), the CI job generates a new .drawio file and commits it. The pull request shows both the text change and the visual change. Reviewers see what changed in the architecture at a glance. Workflow 2: ADR creation as part of the design process. Before writing code for any architectural change, create the ADR in the same pull request as the code change. This is a team norm, not a tool. The pull request template includes an "ADR required" checkbox for changes that affect service boundaries, data stores, communication patterns, or security configurations. The ADR is reviewed alongside the code, so the decision is documented before it's implemented. Workflow 3: Runbook validation during on-call rotations. Each on-call rotation starts with a 30-minute "runbook review" where the incoming on-call engineer reads through the runbooks for their services and flags any that are outdated. This creates a regular cadence of runbook maintenance without requiring a dedicated documentation sprint. Flag outdated runbooks as GitHub issues assigned to the service owner. Workflow 4: Quarterly documentation audits. Once per quarter, run through every architecture diagram and check it against the running infrastructure. Use Diagrams.so to regenerate from current infrastructure descriptions and compare with the existing diagrams. Differences indicate documentation drift. Update the text descriptions, regenerate, and commit. This takes 2 to 4 hours per quarter for a team with 10 to 15 services. The common thread across all four workflows is reducing the cost of documentation updates. AI-generated diagrams take 15 seconds instead of 20 minutes. ADRs in pull requests take 10 minutes to write when the context is fresh. Runbook reviews during on-call handoff take 30 minutes per rotation. Quarterly audits take half a day. The total investment is roughly 2 hours per person per month. The return is documentation that's current, cross-referenced, and actually useful during incidents.
Related diagrams from the gallery


Try these diagram generators
Generate Cloud Architecture Diagrams from Text
Describe your cloud infrastructure in plain English. Get a valid Draw.io diagram with region boundaries, availability zones, managed services, and DR paths.
Generate System Architecture Diagrams from Text
Describe your system's components in plain English. Get a valid Draw.io diagram with services, databases, message queues, caches, and API connections.
Generate AWS architecture diagrams from text
Describe your AWS infrastructure in plain English. Get a valid Draw.io diagram with official AWS icons, VPC boundaries, and Multi-AZ placement.