Generate Multi-Cloud Architecture Diagrams from Text with AI
Describe infrastructure spanning AWS, Azure, GCP, and OCI. Get a valid Draw.io diagram with correct provider icons, cross-cloud networking, and unified identity flows.
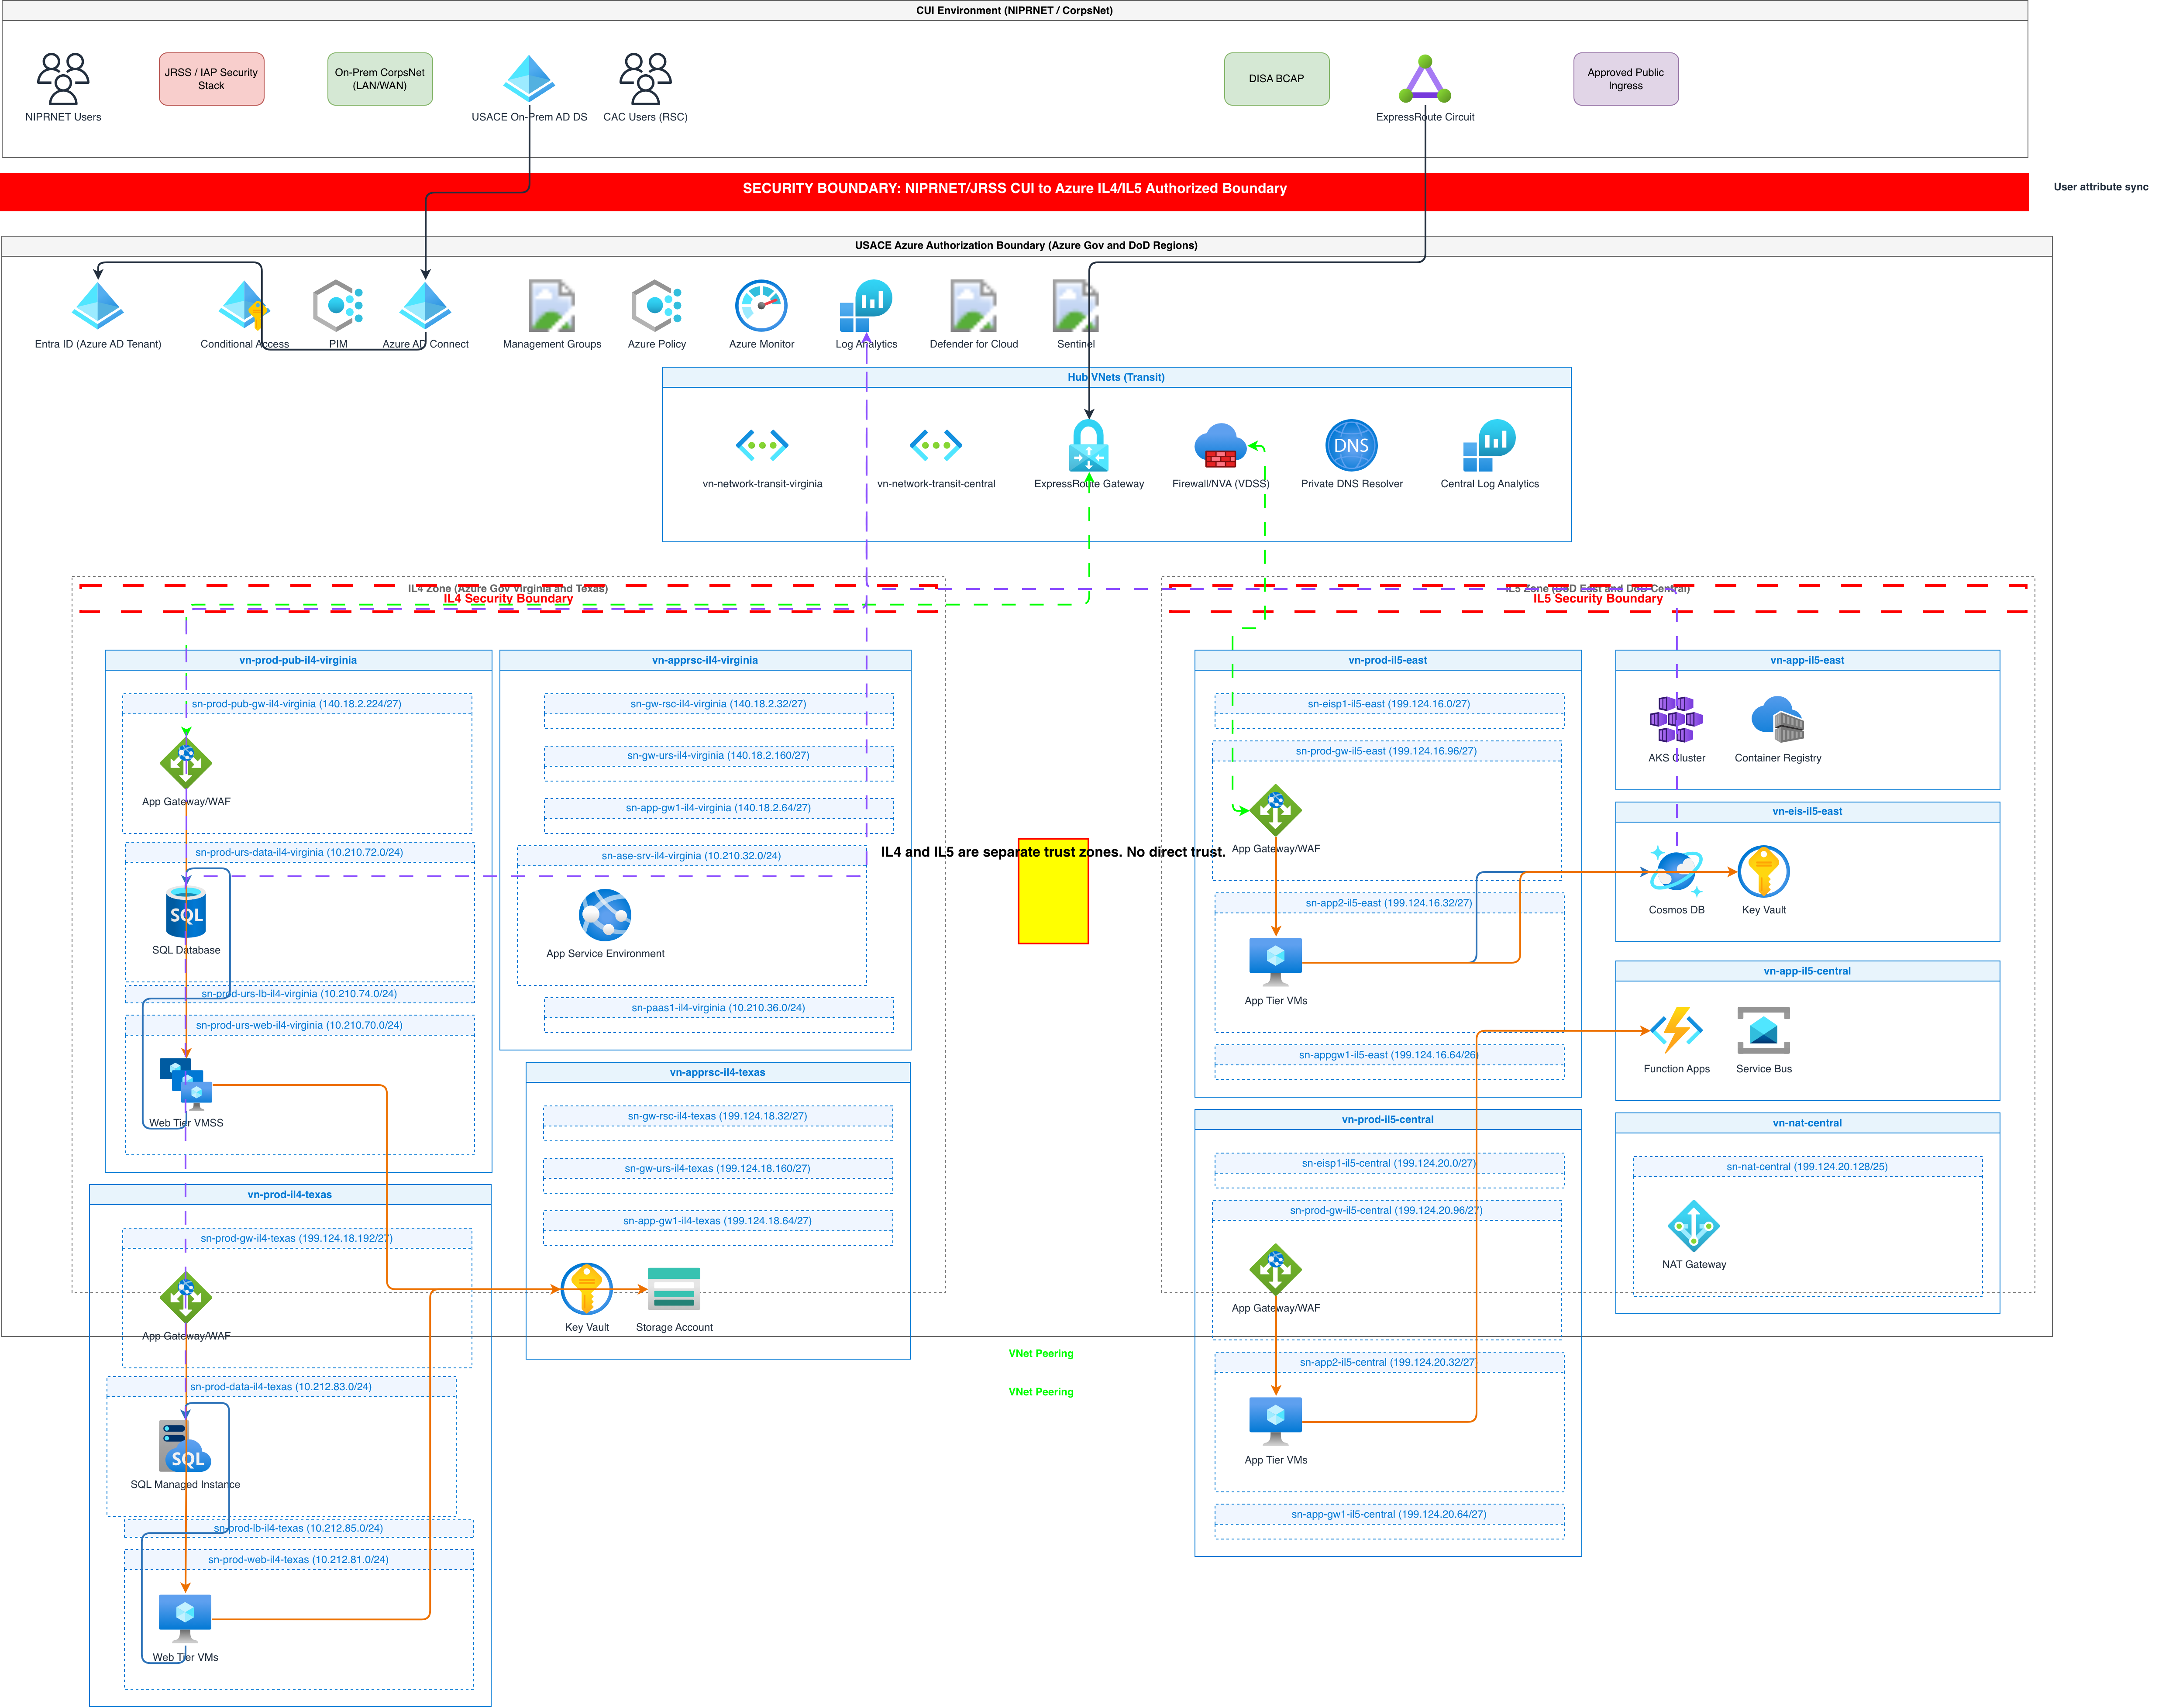
This multi-cloud architecture diagram generator converts plain-text descriptions of cross-provider infrastructure into Draw.io diagrams with icons from every major cloud provider on a single canvas. Describe a setup like an AWS EKS cluster running frontend microservices connected via AWS Direct Connect to an Azure ExpressRoute circuit, with backend data stored in Google BigQuery, identity federated through Okta, and observability centralized in Datadog. The AI selects official icons for each provider, draws cross-cloud network links with latency annotations, and outputs valid mxGraphModel XML. Architecture warnings flag missing security boundaries between provider trust zones (WARN-04) and ambiguous components that could belong to any provider (WARN-05). Grid alignment follows RULE-04. The output opens directly in Draw.io.
What Is a Multi-Cloud Architecture Diagram Generator?
A multi-cloud architecture diagram maps infrastructure that intentionally spans two or more cloud providers. This isn't about vendor-agnostic abstraction. It's about showing the concrete services in each provider and the interconnections between them: Direct Connect to ExpressRoute peering, GoldenGate replicating Oracle data to BigQuery, Kubernetes clusters on EKS and GKE sharing workload via a global load balancer. Drawing these by hand is painful because you need icon sets from every provider, consistent sizing, and clear boundary lines showing where one provider ends and another begins. A multi-cloud architecture diagram generator handles this from a text prompt. You describe something like: 'AWS VPC (10.0.0.0/16) in us-east-1 running EKS 1.29. Azure VNet (10.1.0.0/16) in East US running AKS 1.29. GCP VPC (10.2.0.0/16) in us-central1 running GKE Autopilot. Cross-cloud connectivity via Equinix with Direct Connect, ExpressRoute, and Cloud Interconnect. Okta SAML 2.0 federating to AWS IAM Identity Center, Azure Entra ID, and Google Cloud Identity.' Diagrams.so loads all provider icon libraries simultaneously. Each cloud region renders as a labeled boundary with its correct icons inside. Cross-cloud links show as arrows with connection type and bandwidth labels. WARN-04 fires when traffic crosses provider boundaries without a firewall or security inspection point. WARN-05 catches generic components that should specify which provider they belong to. VLM visual validation detects overlapping icons where provider boundaries meet. The .drawio output preserves all provider icons and is editable in Draw.io without additional plugins.
Key components
- Provider boundary containers for AWS, Azure, GCP, and OCI regions with correct color coding and logos
- Cross-cloud network links labeled with connection type (Direct Connect, ExpressRoute, Cloud Interconnect, FastConnect)
- Unified identity flow arrows showing SAML/OIDC federation from Okta or Entra ID to each provider's IAM
- Multi-cloud Kubernetes clusters (EKS, AKS, GKE) with service mesh connectivity across providers
- Global load balancer or DNS routing layer (Cloudflare, Akamai) distributing traffic to each cloud region
- Centralized observability icons for Datadog, Grafana, or New Relic collecting metrics from all providers
- Data replication arrows showing cross-cloud database sync (DMS, GoldenGate, Dataflow) with latency labels
- Architecture warnings for missing cross-cloud security boundaries (WARN-04) and ambiguous provider assignment (WARN-05)
How to generate with AI
- 1
Describe your multi-cloud infrastructure
Write your cross-provider architecture in plain English. Be specific about which services run in which provider and how they connect. For example: 'Frontend on AWS CloudFront and ALB in us-east-1. API tier on Azure AKS in East US with Application Gateway. Data layer on GCP BigQuery in us-central1. Cross-cloud connectivity via Equinix Cloud Exchange with Direct Connect (1Gbps), ExpressRoute (1Gbps), and Cloud Interconnect (1Gbps). Identity: Okta as IdP federating to AWS SSO, Azure Entra ID, and GCP Workforce Identity.'
- 2
Select architecture diagram type
Choose 'Architecture' as the diagram type. Omit the cloud provider filter so Diagrams.so loads icon libraries for all providers simultaneously. This gives you access to AWS, Azure, GCP, OCI, and Kubernetes icon sets on one canvas. Enable opinionated mode for clean left-to-right layout with internet-facing services on the left and data stores on the right. The AI separates each provider into a labeled boundary region.
- 3
Generate and validate cross-cloud connections
Click generate. The AI produces .drawio XML with provider-specific boundaries, correct icons for each service, and labeled cross-cloud connection arrows. Architecture warnings flag traffic crossing provider boundaries without security inspection (WARN-04) and components not assigned to a specific provider (WARN-05). VLM visual validation catches overlapping icons at boundary edges. Download as .drawio for editing, or export to PNG or SVG for stakeholder presentations.
Example prompt
Multi-cloud architecture for a fintech platform. AWS us-east-1: VPC (10.0.0.0/16) with CloudFront CDN, WAF v2, ALB in public subnets, EKS 1.29 Fargate cluster running frontend and BFF services in private subnets, RDS PostgreSQL 16 Multi-AZ for user data. Azure East US: VNet (10.1.0.0/16) with Application Gateway and AKS 1.29 running payment processing microservices, Azure SQL Managed Instance for transaction data, Azure Key Vault for PCI secrets. GCP us-central1: VPC (10.2.0.0/16) with BigQuery for analytics and Vertex AI for fraud detection models, Cloud Pub/Sub for event streaming from AWS and Azure. Cross-cloud connectivity: AWS Direct Connect and Azure ExpressRoute to Equinix DC5 in Ashburn, GCP Partner Interconnect to same facility. All three at 10Gbps. Identity: Okta as central IdP with SAML 2.0 federation to AWS IAM Identity Center, Azure Entra ID, and GCP Workforce Identity. Observability: Datadog agents on EKS and AKS, Datadog integration with GCP for BigQuery metrics. Terraform Cloud managing all three providers. Show the data flow: user request hits CloudFront, routes to EKS frontend, BFF calls Azure AKS payment API, payment events publish to GCP Pub/Sub, Vertex AI scores transactions, results written to BigQuery.
Example diagrams from the gallery


Multi-Cloud Active-Active vs Active-Passive vs Cloud-Agnostic Abstraction
Multi-cloud architectures fall into three primary patterns. Active-active runs workloads simultaneously across providers. Active-passive uses a secondary provider for disaster recovery. Cloud-agnostic abstraction layers attempt to minimize provider lock-in. Each pattern produces a fundamentally different diagram with different networking, data replication, and operational complexity.
| Feature | Multi-Cloud Active-Active | Multi-Cloud Active-Passive | Cloud-Agnostic Abstraction |
|---|---|---|---|
| Workload distribution | Different services run on different providers simultaneously based on best-fit: compute on AWS, analytics on GCP, AI on Azure | Primary workload on one provider; secondary provider holds standby replicas activated during regional or provider-wide outages | Same application code deploys to any provider via abstraction layers like Kubernetes, Terraform, and Crossplane |
| Data replication | Real-time sync between providers: DMS, GoldenGate, or custom CDC pipelines with conflict resolution logic | Async replication from primary to standby: RDS cross-region read replicas, Azure SQL geo-replication, or backup restore | Database runs on a portable engine (CockroachDB, TiDB, YugabyteDB) that handles multi-region replication internally |
| Network complexity | Dedicated interconnects between all providers (Direct Connect + ExpressRoute + Cloud Interconnect) at the same colocation | Primary provider has production networking; standby has minimal connectivity activated during failover only | Overlay network (Cilium, Aviatrix, Alkira) abstracts provider networking; same IP ranges work across clouds |
| Diagram complexity | Multiple provider boundaries with active workloads, cross-cloud data arrows, and shared identity/observability layers | Primary boundary is detailed; standby boundary shows minimal resources with dashed 'failover activation' arrows | Kubernetes cluster boundaries replace provider boundaries; abstract service icons instead of provider-specific ones |
| Identity model | Central IdP (Okta, Entra ID) federating SAML/OIDC to each provider's native IAM independently | IdP configured for both providers but only primary actively serves tokens; DNS failover switches auth endpoints | SPIFFE/SPIRE or service mesh identity replaces provider IAM; workload identity is platform-independent |
| Best suited for | Regulated industries needing provider diversity, best-of-breed service selection, or acquisition integration | Organizations with strict DR requirements wanting provider-level redundancy without active-active complexity | Platform teams building internal developer platforms that abstract infrastructure from application teams |
When to use this pattern
Use a multi-cloud architecture diagram when your infrastructure intentionally spans two or more cloud providers and you need to show the interconnections between them. It's the right choice for documenting cross-provider networking, federated identity, and data replication paths. If your workloads run on a single provider with a simple backup on another, an active-passive multi-cloud diagram is more appropriate. Don't force multi-cloud diagrams onto single-provider architectures. If each team independently uses a different cloud, those are separate single-cloud diagrams, not a multi-cloud architecture. Keep the diagram focused on cross-provider boundaries and data flows rather than deep-diving into each provider's internal topology.
Frequently asked questions
Does the generator support icons from all cloud providers?
Yes. Diagrams.so loads icon libraries for AWS, Azure, GCP, OCI, and Kubernetes simultaneously when no single provider filter is selected. Each multi-cloud architecture diagram uses the correct official icons for every service mentioned. The AI assigns provider-specific colors and boundary labels to prevent confusion between similar services across clouds.
How does the AI show cross-cloud network connections?
Describe your interconnect setup including connection types and bandwidth. The AI draws labeled arrows between provider boundaries showing Direct Connect, ExpressRoute, Cloud Interconnect, or FastConnect links. Connection labels include bandwidth, colocation facility, and BGP ASN details. VPN tunnels render as dashed backup lines alongside dedicated circuits.
Can I show unified identity federation across clouds?
Yes. Specify your identity provider and federation targets. The AI renders the IdP (Okta, Entra ID, Ping) as a central icon with SAML or OIDC arrows flowing to each provider's IAM service. Federation details like trust relationships and role mappings appear as arrow labels. WARN-04 flags missing identity boundaries.
What warnings apply to multi-cloud diagrams?
WARN-04 fires when data crosses provider boundaries without a security inspection point like a firewall, WAF, or API gateway. WARN-05 catches components not assigned to a specific provider, which creates confusion in multi-cloud contexts. WARN-01 flags workloads running in a single availability zone within any provider.
Can I include Terraform or IaC references in the diagram?
Yes. Mention your IaC tooling in the prompt. The AI adds Terraform Cloud, Pulumi, or Crossplane as management plane icons with arrows pointing to each provider boundary they control. This shows the operational layer alongside the infrastructure topology. Pipeline connections from CI/CD to Terraform appear as deployment flow arrows.
Related diagram generators
Generate Hybrid Cloud Architecture Diagrams from Text with AI
Describe your on-premises to cloud connectivity in plain English. Get a valid Draw.io diagram with data center boundaries, VPN tunnels, dedicated links, and security zones.
Generate AWS architecture diagrams from text
Describe your AWS infrastructure in plain English. Get a valid Draw.io diagram with official AWS icons, VPC boundaries, and Multi-AZ placement.
Generate Azure Architecture Diagrams from Text with AI
Describe your Azure infrastructure in plain English. Get a valid Draw.io diagram with official Azure icons, VNet boundaries, resource groups, and NSG rules.
Generate GCP Architecture Diagrams from Text
Describe your Google Cloud infrastructure in plain English. Get a valid Draw.io diagram with official GCP icons, project boundaries, and VPC networking.