
Convert Terraform to an architecture diagram
Paste your Terraform configuration and get a native, editable .drawio architecture diagram — with official cloud icons, VPC boundaries, and the connections drawn for you.
To convert Terraform to a diagram with Diagrams.so, paste your HCL (or describe the stack in plain English) and the AI reads the resources and their references, maps each one to its official cloud icon, groups them inside the right VPC and subnet boundaries, and returns a native .drawio file you can edit in Draw.io. It takes a few seconds, needs no local tooling, and the output is a real editable diagram rather than a static image — so you can rearrange it, annotate it, and export it to PNG or SVG.
What you get with Diagrams.so
Text-to-diagram
Describe or paste your source in plain English and get a diagram back in seconds.
Native .drawio export
Output is real mxGraphModel XML that opens and stays editable in Draw.io.
30+ icon libraries
Official AWS, Azure, GCP, and Kubernetes icon sets, auto-selected per service.
Architecture warnings
Best-practice checks flag issues like single-AZ or public exposure, with one-click fixes.
Community gallery
Browse, fork, and remix real architecture diagrams to start from a proven pattern.
Voice-to-diagram
Dictate an architecture out loud and watch it render — available on every plan.
How to convert Terraform to an architecture diagram
- 1
Paste your Terraform
Copy the relevant resources from your main.tf, or a whole module, into the prompt box. You can paste HCL directly — there is nothing to install and no provider credentials are needed, because the diagram is built from the configuration text, not from your live cloud account.
- 2
The AI reads the resource graph
Diagrams.so parses the resource types (aws_vpc, aws_subnet, aws_lb, aws_instance, aws_db_instance and so on) and the references between them — a subnet that points at a VPC, an instance in a subnet, a security group attached to a load balancer — to reconstruct how the pieces connect.
- 3
Icons and boundaries are applied
Each resource is matched to its official AWS, Azure, or GCP icon. VPCs and subnets become nested boundaries, availability zones become columns, and public, private, and isolated tiers are laid out in the order traffic flows through them.
- 4
Review the architecture warnings
The warnings engine flags common issues it sees in the config — a single-AZ database, a public load balancer with no WAF, a subnet with an open route to the internet — so you can catch them before the diagram goes into a review or a proposal.
- 5
Edit and export the .drawio
Open the result in the editor to rename, regroup, or add notes, then download the native .drawio file or export to PNG or SVG. Because it is real mxGraphModel XML, it also opens in Draw.io desktop, the VS Code extension, and Confluence.
Worked example
Terraform (main.tf)
resource "aws_vpc" "main" {
  cidr_block = "10.0.0.0/16"
}

resource "aws_subnet" "public" {
  count             = 2
  vpc_id            = aws_vpc.main.id
  cidr_block        = "10.0.${count.index}.0/24"
  availability_zone = element(["us-east-1a", "us-east-1b"], count.index)
}

resource "aws_lb" "web" {
  name               = "web-alb"
  load_balancer_type = "application"
  subnets            = aws_subnet.public[*].id
}

resource "aws_instance" "app" {
  count         = 2
  ami           = "ami-0abcd1234"
  instance_type = "t3.medium"
  subnet_id     = aws_subnet.public[count.index].id
}

resource "aws_db_instance" "db" {
  engine               = "postgres"
  instance_class       = "db.t3.medium"
  multi_az             = true
  db_subnet_group_name = aws_db_subnet_group.main.name
}
Resulting diagram
A VPC boundary labelled 10.0.0.0/16 containing two Availability Zone columns (us-east-1a and us-east-1b). An Application Load Balancer sits in the public subnets and fans out to two EC2 instances, which connect down to an RDS PostgreSQL instance drawn in Multi-AZ mode with a synchronous-replication arrow between the primary and standby. Each resource carries its official AWS icon, and the whole thing is editable: drag a node, add a CloudFront distribution, or relabel a subnet, then export it.
Why turn Terraform into a diagram at all?
Terraform tells you exactly what exists, but it does not show you the shape of the system. A reviewer reading three hundred lines of HCL has to hold the whole graph in their head — which subnet each instance lands in, what the load balancer routes to, where the single points of failure are. A diagram makes that legible in one screen. The common ways teams close this gap each have a cost: hand-drawing in Draw.io or Lucidchart is accurate but slow and goes stale the moment the config changes; terraform graph emits a Graphviz DOT file that is complete but visually dense and unreadable for anything non-trivial; and tools like Rover or InfraMap render the plan but produce their own layout you cannot easily edit or brand. Diagrams.so aims at the middle: a fast, editable, presentation-ready diagram with real cloud icons that you own as a .drawio file. It is well suited to design reviews, onboarding, client proposals, and architecture documentation that lives in the repo next to the code.
What the AI reads, and what it cannot know
The conversion works from the structure of your configuration. Resource types tell it which icon to use; interpolations and references (aws_subnet.public.id inside an aws_instance, a security group id on a load balancer) tell it what connects to what; count and for_each tell it how many of a thing to draw; and module boundaries suggest logical groupings. What it cannot infer is anything that only exists at apply time. Values that come from data sources, remote state, or variables you did not include will not be resolved, so paste the variable definitions or a representative tfvars alongside the resources if the wiring depends on them. Because this is an AI reconstruction rather than a deterministic parse of your state file, treat the first draft as a strong starting point: check that every resource you care about appears, that the connections match your intent, and adjust the diagram directly for anything the config left implicit. For most stacks the draft is accurate enough to edit rather than redraw.
From HCL to an editable .drawio you own
The output is native mxGraphModel XML — the same format Draw.io uses — not a screenshot or a proprietary export. That matters for a Terraform workflow, because your diagram can live in the same repository as your modules, get updated when the infrastructure changes, and be reviewed in a pull request like any other file. You can commit the .drawio, embed it in a README or Confluence page, or hand it to a teammate who edits it in the free Draw.io desktop app without a Diagrams.so account. When the stack grows, you do not start over: paste the new resources, or open the existing diagram and add them by hand. And because the same engine also generates from plain English, you can sketch a target-state architecture the same way before you have written the Terraform for it, then compare the two.
Example diagrams from the gallery

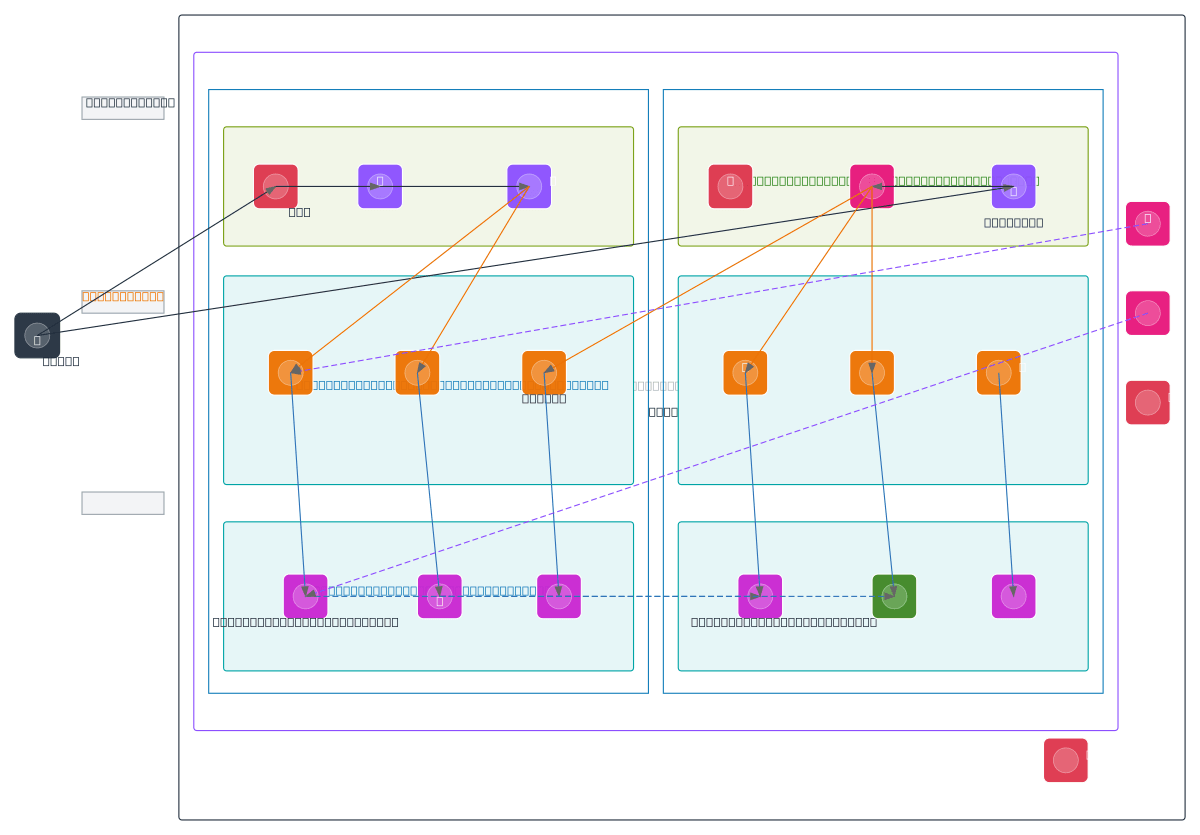
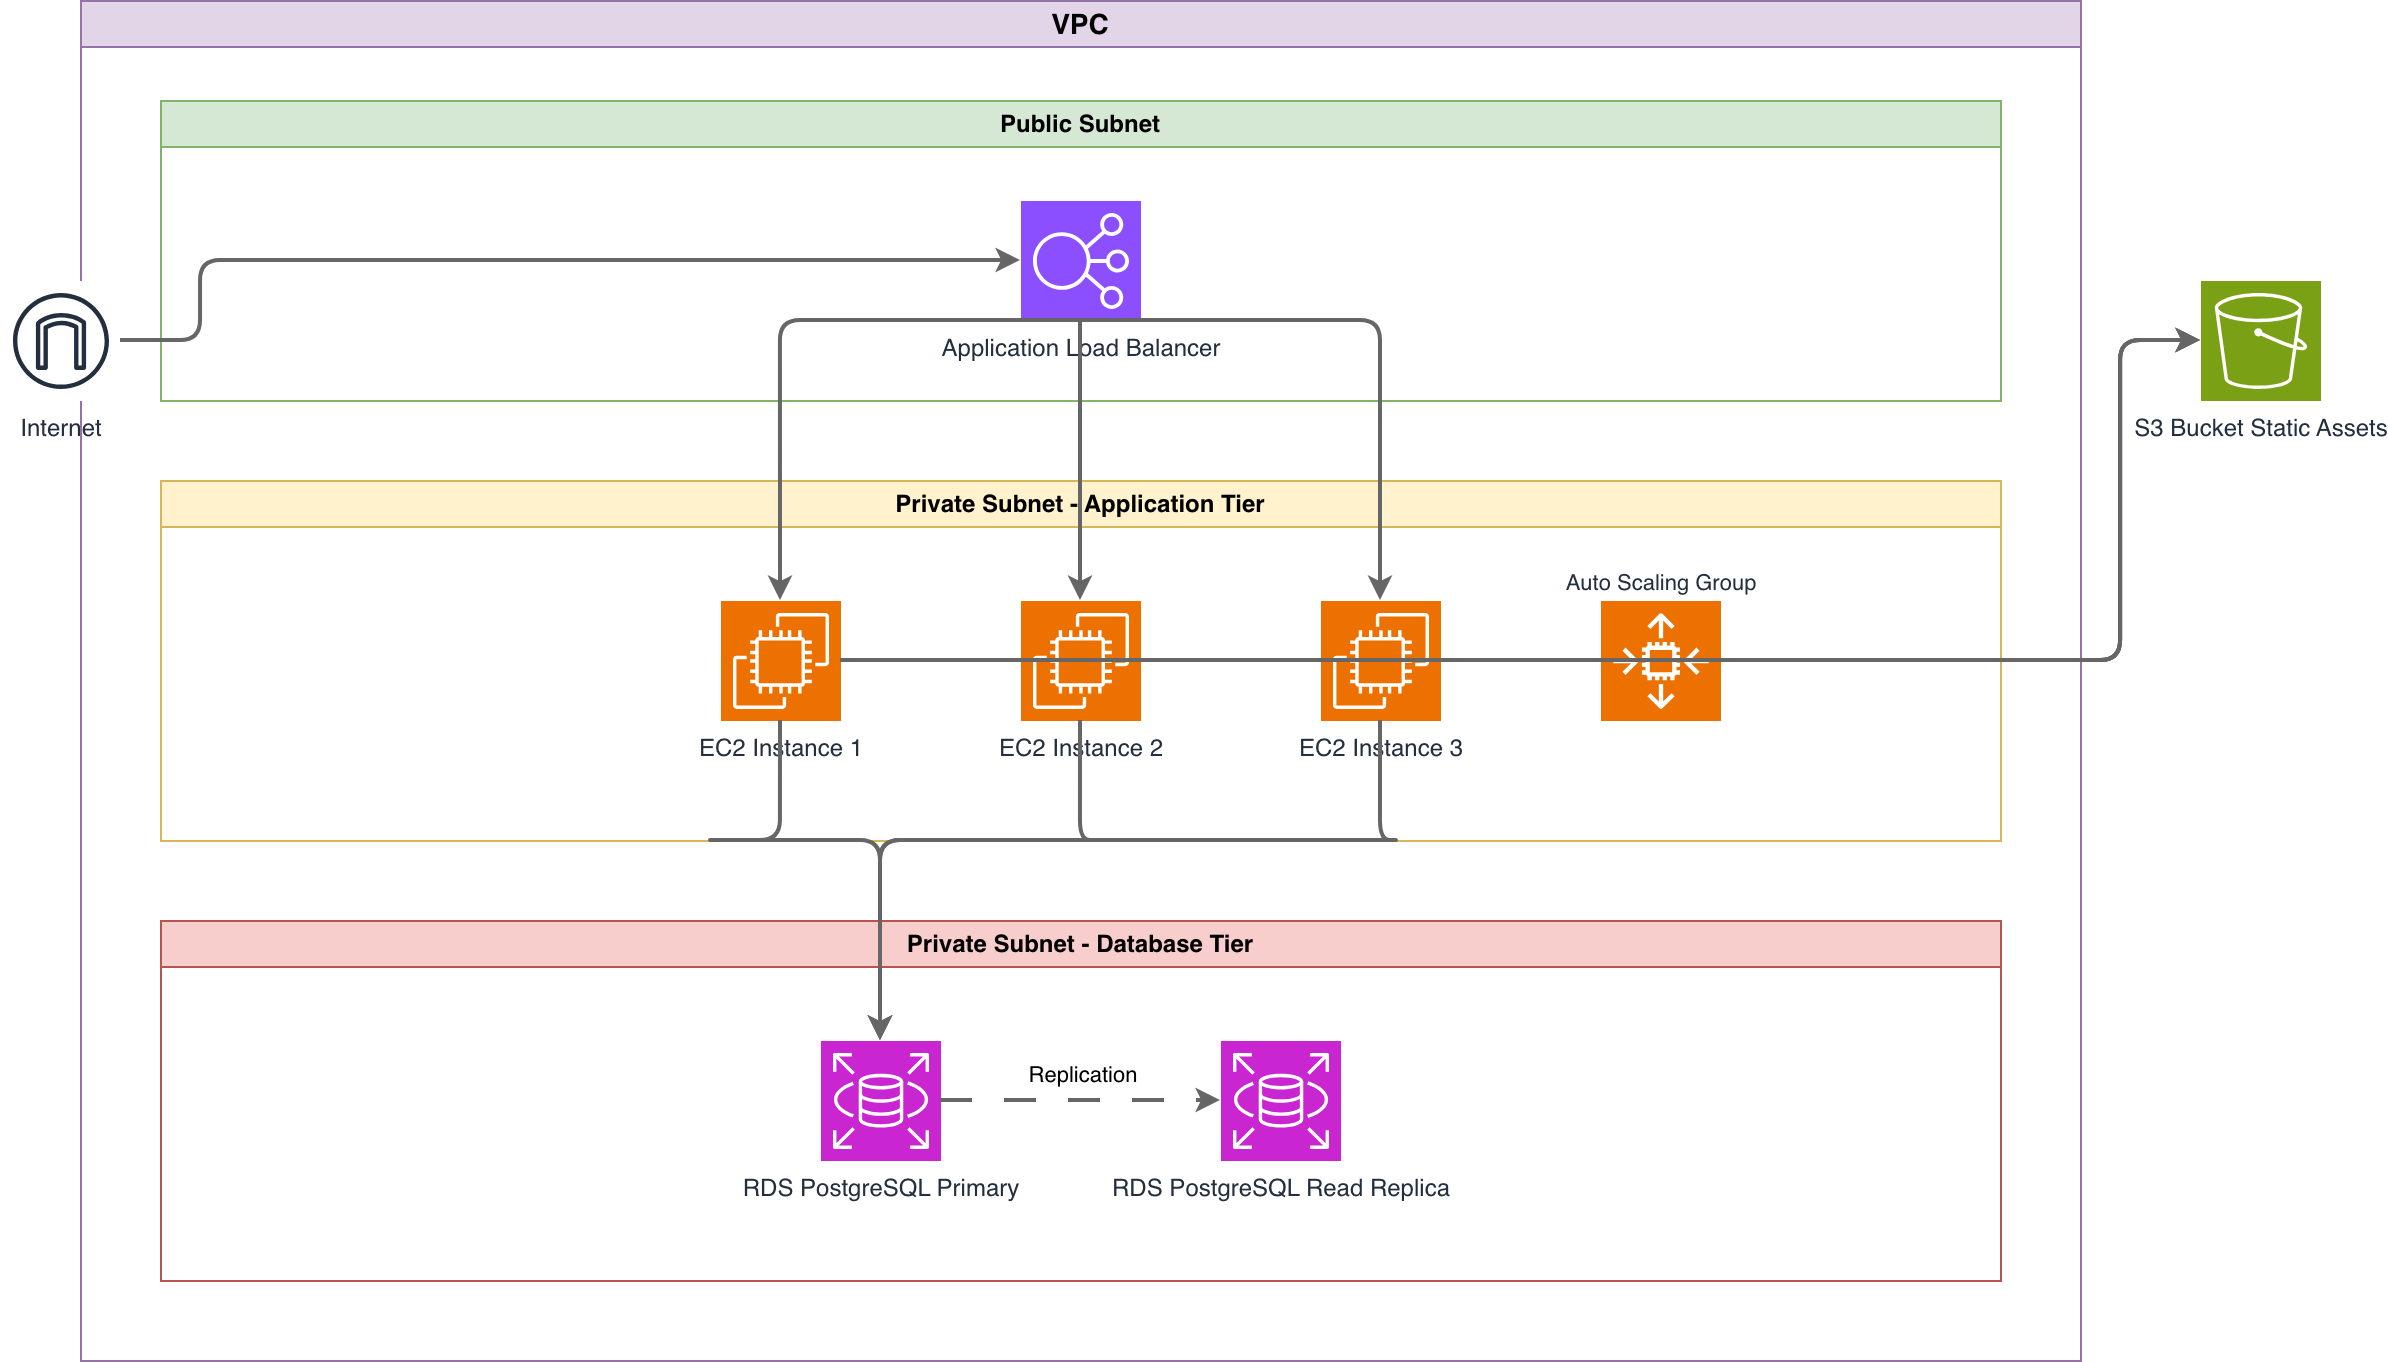
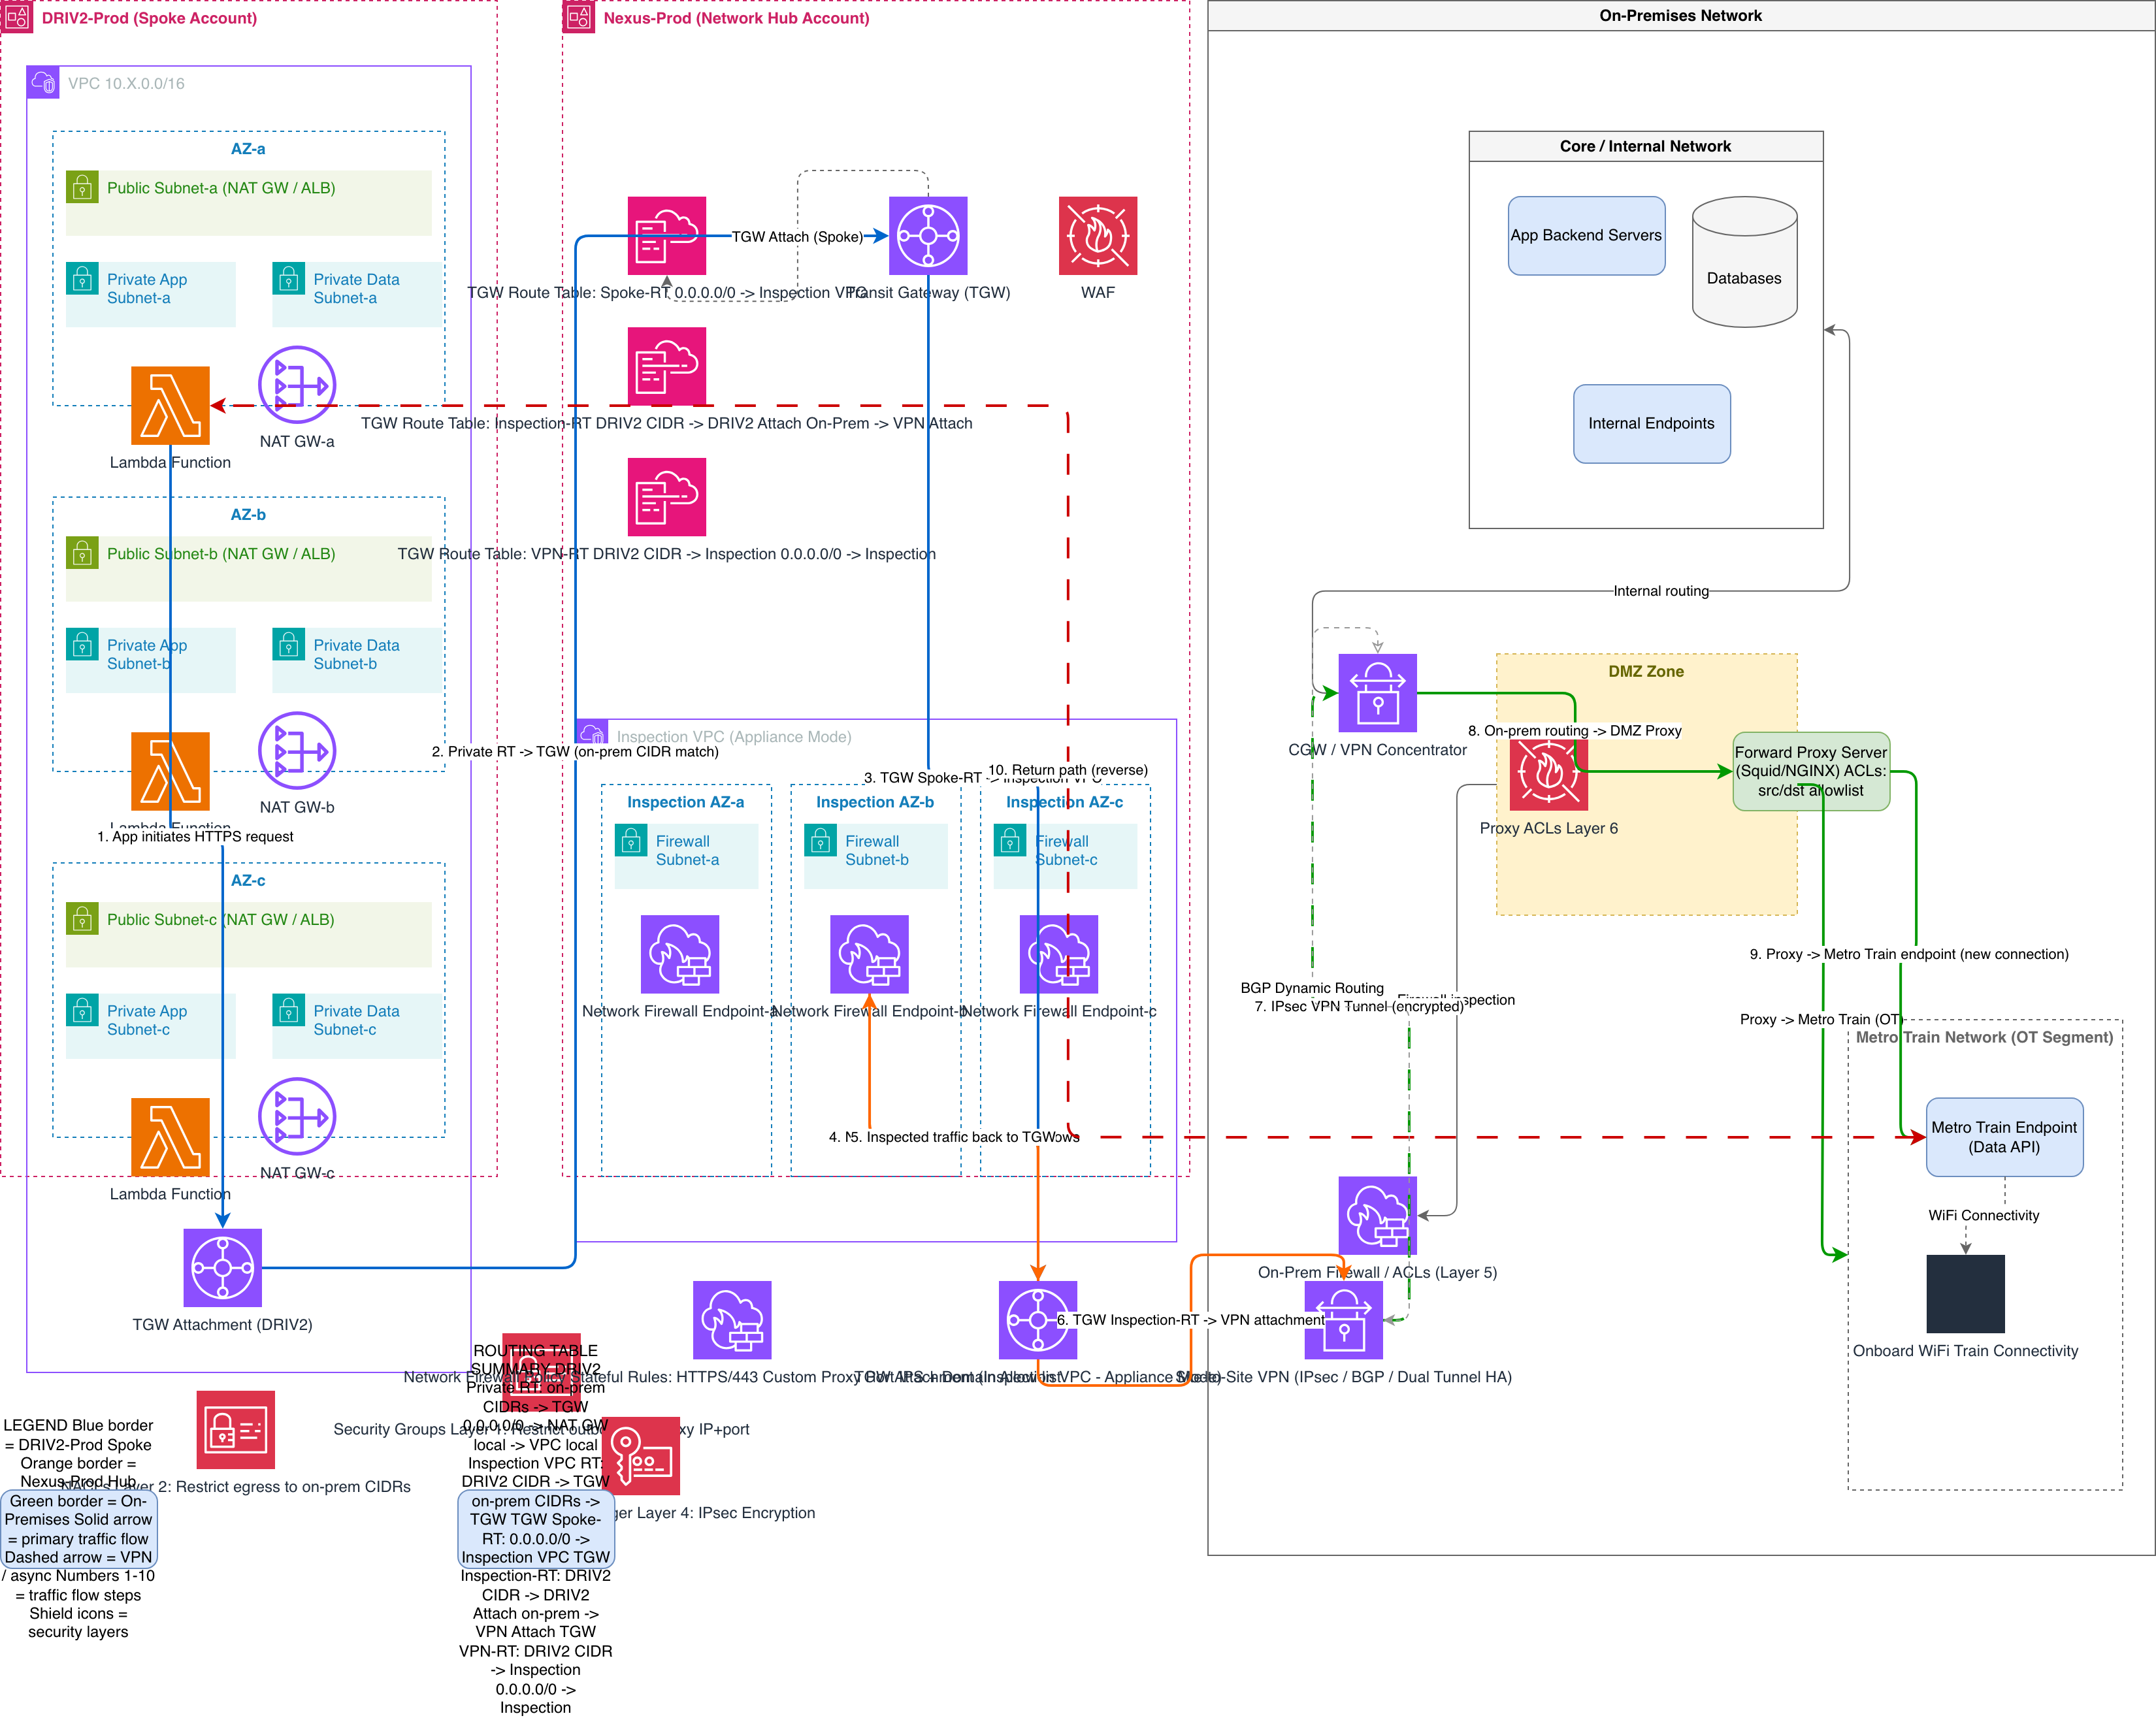
Diagrams.so vs terraform graph and manual drawing
There is more than one way to visualise a Terraform stack. The right choice depends on whether you want a raw dependency graph, a deterministic render of the plan, or an editable, presentation-ready diagram you can brand and keep.
| Feature | Diagrams.so | terraform graph | Manual (Draw.io) |
|---|---|---|---|
| Input | Paste HCL or describe in English | Runs against your config/state | You place every shape yourself |
| Output format | Editable .drawio XML | Graphviz DOT / rendered image | Editable .drawio XML |
| Cloud icons | Official AWS/Azure/GCP, auto-selected | Generic nodes and edges | You search and place them |
| Readability | Tiered, grouped by VPC/subnet | Dense for non-trivial graphs | As good as you make it |
| Architecture warnings | Built-in best-practice checks | None | None |
| Speed | Seconds | Fast, but needs cleanup | Slow |
Frequently asked questions
Does Diagrams.so run terraform plan or need my cloud credentials?
No. The diagram is built from the Terraform configuration text you paste, not from your live account, so no AWS, Azure, or GCP credentials and no terraform apply are involved. Nothing is provisioned and no state is read.
Can I paste a whole module or just resources?
Both work. You can paste individual resource blocks, a full main.tf, or a module. If the wiring depends on variables or a tfvars file, include those too so the references resolve; anything that only exists at apply time cannot be inferred from the config alone.
How much Terraform can I paste at once?
The prompt box accepts up to 30,000 characters — roughly 800 to 1,000 lines of HCL — which covers most single modules and the core of a larger stack. For a bigger codebase, paste the module that defines the architecture (the network, compute, and data layers) rather than the whole repo, then add the rest with follow-up edit prompts.
Is the output really editable, or just an image?
It is a native .drawio (mxGraphModel XML) file, fully editable. You can drag nodes, regroup them, add components, relabel subnets, and then export to PNG or SVG. It opens in Draw.io desktop, the VS Code Draw.io extension, and Confluence.
How accurate is the AI conversion?
For typical stacks it reconstructs the resources and their connections well enough to edit rather than redraw. Because it is an AI reconstruction, not a deterministic parse of your state, review the first draft: confirm every resource you care about is present and adjust anything the configuration left implicit.
Which clouds are supported?
AWS, Azure, and GCP resource types all map to their official icon sets, and Kubernetes resources are supported too. Mixed multi-cloud configurations render into one diagram with each provider's correct icons.
Can I keep the diagram in sync with my Terraform?
The diagram is a file you own, so the practical workflow is to commit the .drawio next to your modules and regenerate or hand-edit it when the infrastructure changes. There is no automatic live binding to your state, which keeps the diagram stable and reviewable in pull requests.