Cloud Provider Icon Libraries: AWS, Azure, GCP, OCI Guide
Every cloud provider publishes an official icon set for architecture diagrams, but each one follows different naming conventions, color schemes, and file formats. This guide covers what each library includes, how they differ, and how Diagrams.so handles icon selection automatically across 30+ libraries.
Why official icons matter for architecture reviews and documentation approval
Architecture diagrams with unofficial icons get rejected in review. This sounds like a minor aesthetic concern, but it causes real workflow problems. A diagram that uses a generic cylinder for Amazon RDS and a generic box for AWS Lambda doesn't communicate anything about the specific services. The reviewer has to read every label, mentally map it to the correct service, and build a mental model of the architecture from text alone. The diagram becomes a fancy label layout rather than a visual communication tool. Official icons solve this because they carry semantic meaning through visual recognition. An architect who works with AWS daily recognizes the EC2 icon, the Lambda icon, and the S3 icon at a glance. They don't need to read labels. This visual shorthand speeds up review meetings from 45 minutes to 20 minutes because the discussion focuses on architecture decisions instead of diagram interpretation. Enterprise architecture teams enforce icon standards for a second reason: brand compliance. When diagrams go into RFPs, SOC 2 evidence packages, customer-facing documentation, or conference presentations, using unofficial icons suggests a lack of professionalism. AWS, Azure, GCP, and Oracle all publish usage guidelines alongside their icon sets. These guidelines specify minimum sizes, required spacing, acceptable color modifications, and context restrictions. A third reason applies to teams that maintain diagram libraries. When every architect uses official icons, diagrams look consistent across teams. When each person uses whatever they found on Google Images, the diagram library becomes a visual inconsistency nightmare. New team members can't distinguish between a 2019-era icon and a current one. Services that were renamed (like Azure AD to Microsoft Entra ID) keep their old icons in some diagrams and new icons in others. Diagrams.so addresses all three problems by including official icon sets from every major cloud provider in its 30+ icon libraries. The AI selects the correct icon for each service name per RULE-02, ensuring consistency without manual lookup. This is the default behavior, not an option you need to enable.
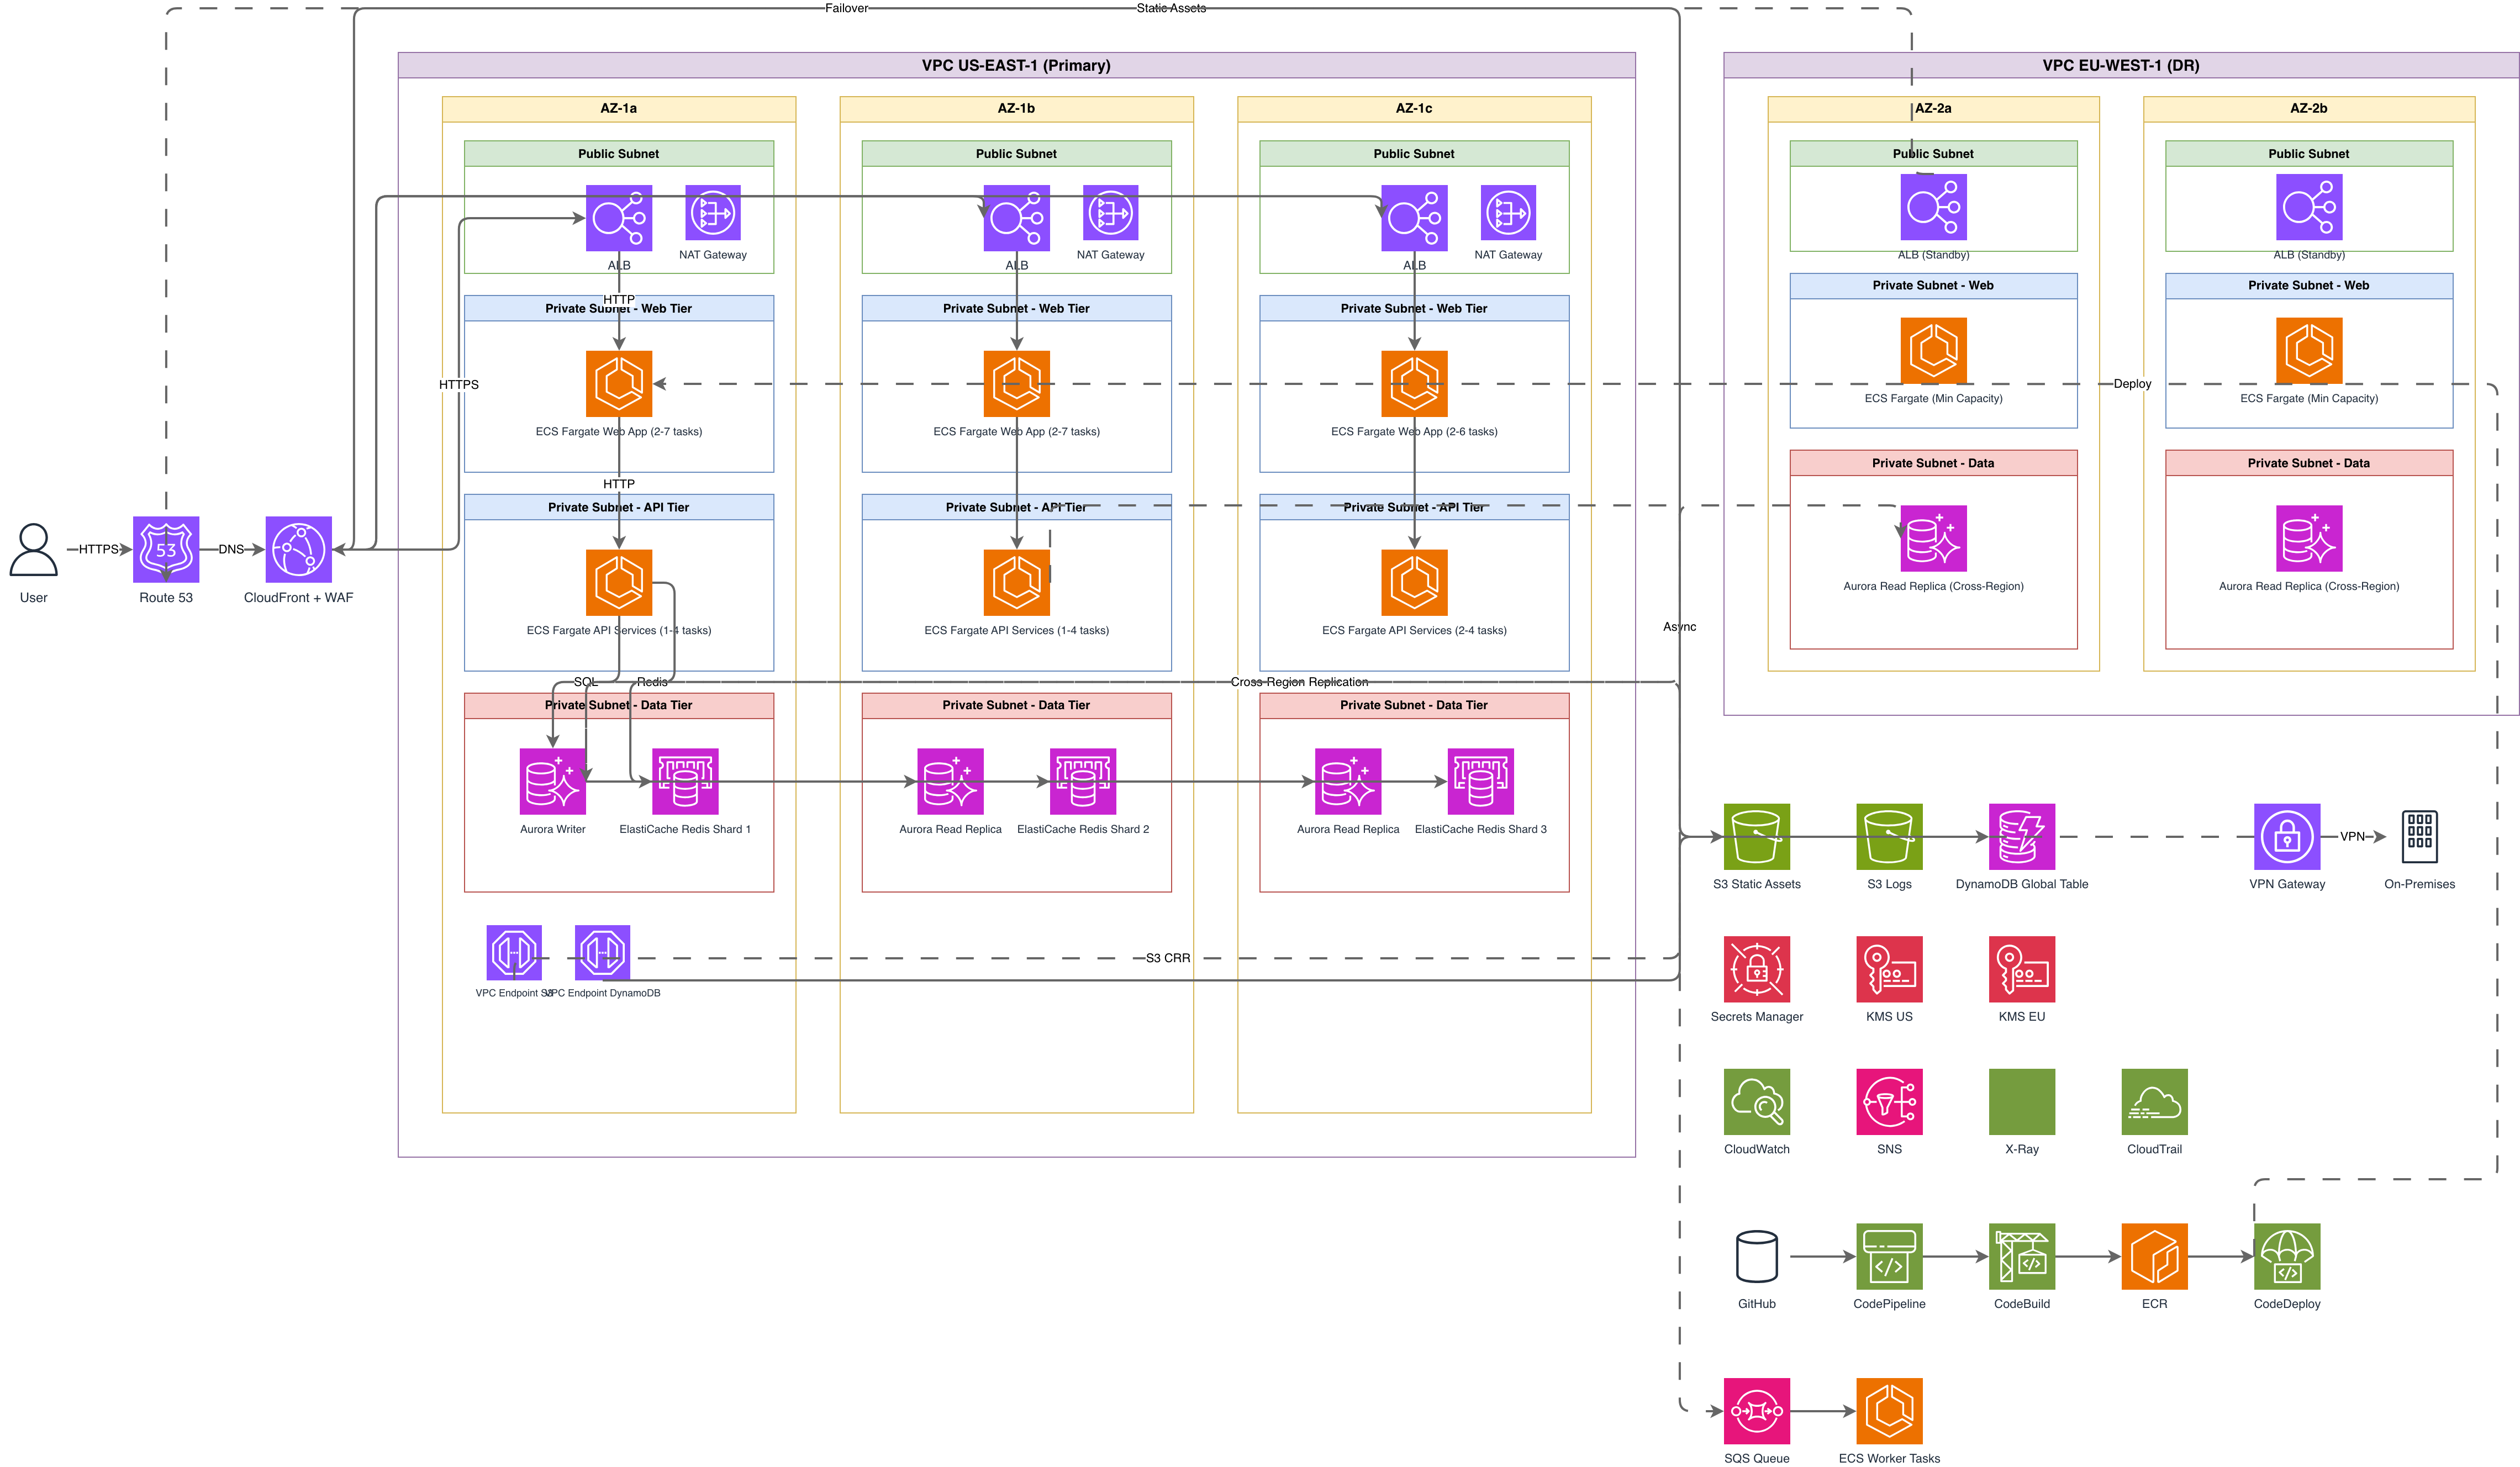
AWS Architecture Icons 2024: what the set includes and naming conventions
Amazon publishes the AWS Architecture Icons package annually. The 2024 release contains over 1,100 icons organized into 22 service categories: Compute, Storage, Database, Networking, Security/Identity/Compliance, Analytics, Application Integration, Business Applications, Cloud Financial Management, Containers, Customer Enablement, Developer Tools, End User Computing, Frontend Web & Mobile, Game Tech, Internet of Things, Machine Learning, Management & Governance, Media Services, Migration & Transfer, Quantum Technologies, and Satellite. Each icon exists in three variants: a 48x48 pixel service icon (the main icon used in architecture diagrams), a 64x64 pixel resource icon (showing specific resources within a service, like an EC2 instance vs the EC2 service), and a category icon (the generic icon for the entire service category). The service icon is what you use 90% of the time. Resource icons are for detailed deployment diagrams where you need to distinguish between an RDS instance and an RDS read replica. Naming conventions follow a strict pattern: "Arch_[ServiceName]_48" for service icons and "Res_[ServiceName]_[ResourceType]_48" for resource icons. For example, "Arch_Amazon-S3_48" is the S3 service icon, while "Res_Amazon-S3_S3-Standard_48" is the specific S3 Standard storage class icon. This naming convention matters when you're searching the icon library manually, but Diagrams.so handles this mapping automatically. Write "S3 bucket" and the AI selects the correct service icon. AWS icons use a consistent color palette tied to service category. Compute services use orange. Database services use blue. Security services use red. Networking services use purple. Storage services use green. This color coding is intentional: in a complex diagram with 30+ components, the color clusters help reviewers visually group related services without reading labels. The package includes group icons for regions, availability zones, VPCs, subnets, security groups, and accounts. These group icons render as labeled boundary rectangles that contain other icons. Correct nesting (region contains VPC, VPC contains subnet, subnet contains EC2 instances) communicates the deployment topology. Diagrams.so applies this nesting based on your prompt. Mention a VPC and subnets, and the AI wraps your compute resources in the correct boundary hierarchy. AWS updates the icon set when new services launch. Services like Amazon Bedrock, Amazon Q, and AWS Clean Rooms got icons in the 2024 release. If you're using a local icon library from 2022, you're missing icons for roughly 40 services that launched since then.
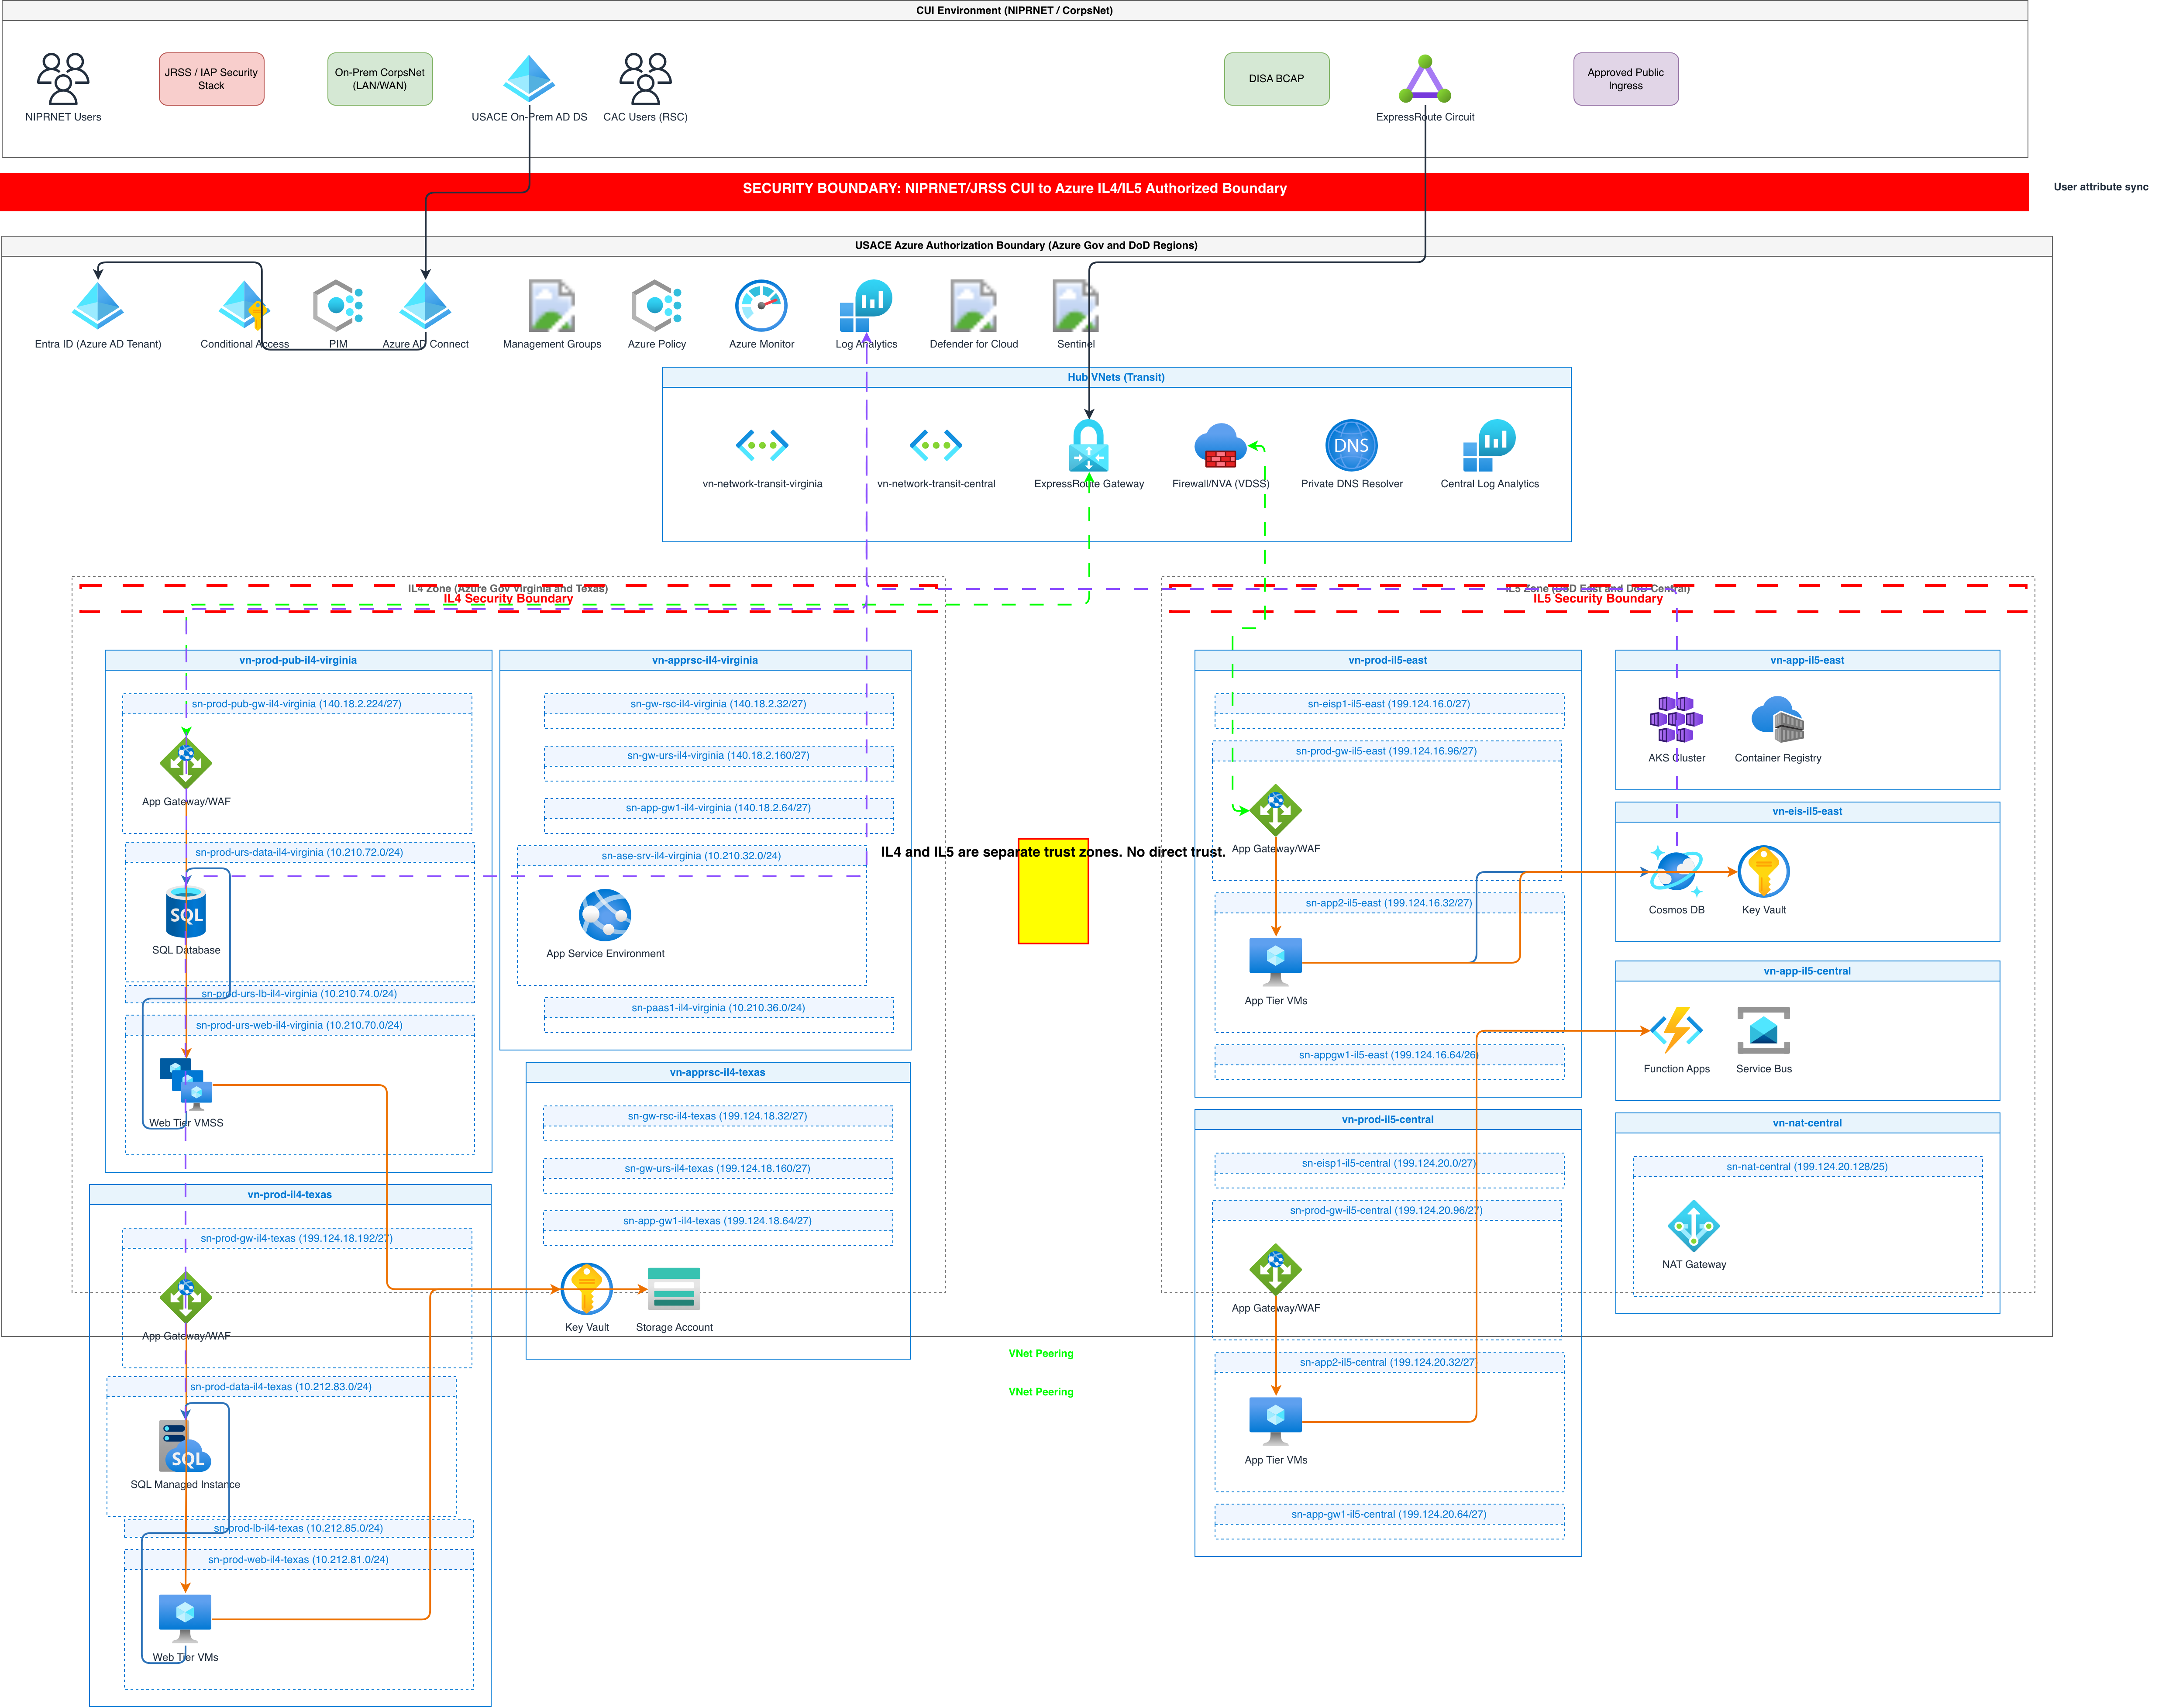
Azure icon set: categories, Visio stencils vs SVG, and where to find the latest version
Microsoft publishes Azure architecture icons in two formats: SVG files for web and modern design tools, and Visio stencils (.vssx) for teams using Microsoft Visio. The SVG format is what Diagrams.so and Draw.io use. The Visio stencils are relevant only if your organization mandates Visio for architecture documentation, which is becoming less common as .drawio gains adoption. The Azure icon set contains over 1,000 icons organized by service category: AI + Machine Learning, Analytics, Compute, Containers, Databases, DevOps, General, Identity, Integration, Internet of Things, Management + Governance, Media, Migration, Mixed Reality, Mobile, Networking, Security, Storage, and Web. Each icon follows Microsoft's Fluent Design System with a consistent line weight, rounded corners, and a blue-dominant color palette. Unlike AWS which uses distinct colors per category, Azure uses a more uniform blue-and-white theme with accent colors for specific services. Azure SQL Database has a blue database icon. Azure Cosmos DB has a distinctive multi-colored icon representing its multi-model capability. Azure Functions has a yellow lightning bolt on blue. These accent colors are service-specific rather than category-specific, so you can't rely on color alone to identify service categories. Microsoft distributes the icons through the Azure Architecture Center documentation page. The download is a ZIP file containing SVG files organized into folders by category. The naming convention uses the service's display name: "Azure App Service.svg", "Azure Kubernetes Service.svg", "Microsoft Defender for Cloud.svg". Note that some services use "Azure" prefix while others use "Microsoft" prefix, which reflects Microsoft's branding strategy for services that span Azure and Microsoft 365. Service renaming is a particular challenge with Azure icons. Azure Active Directory became Microsoft Entra ID. Azure Sentinel became Microsoft Sentinel. Azure Monitor's sub-products (Application Insights, Log Analytics, Azure Monitor Metrics) each have separate icons. Azure Container Instances, Azure Container Apps, and Azure Kubernetes Service are three distinct services with three distinct icons, but teams frequently confuse them. Using the wrong icon in a diagram suggests you don't understand the service differences. Diagrams.so maps both old and new service names to the current icon. Write "Azure AD" and you get the Microsoft Entra ID icon. Write "Azure Sentinel" and you get the Microsoft Sentinel icon. This reduces friction for architects who still use the old names conversationally while ensuring the diagram uses current branding. The group icons for Azure include subscriptions, resource groups, management groups, and VNets. Azure diagrams need to show the subscription boundary more than other clouds because it's the unit of billing, RBAC scope, and service quotas. A diagram without subscription boundaries leaves reviewers guessing about the RBAC model.
Google Cloud icons: structure, brand colors, and product category organization
Google publishes its cloud architecture icons as part of a broader diagramming resources package. The icons are available as SVG files, are usable in Google Slides, Draw.io, and Lucidchart, and follow Google's Material Design visual language. Each icon uses clean geometric shapes with consistent stroke widths and a limited color palette. GCP icons use product-specific colors rather than category-wide colors. BigQuery is a bold blue. Pub/Sub uses a darker blue with a distinctive messaging symbol. Cloud Functions uses an orange function icon. Cloud Run uses a blue running-figure icon. Cloud Storage uses a blue bucket. These distinct visuals per service make GCP icons among the most recognizable at small sizes because the shapes and colors are unique enough to identify without reading labels. The icon set organizes into product categories that mirror the GCP Console navigation: Compute (Compute Engine, GKE, Cloud Run, App Engine, Cloud Functions), Storage (Cloud Storage, Persistent Disk, Filestore), Databases (Cloud SQL, Cloud Spanner, Firestore, Bigtable, Memorystore, AlloyDB), Networking (VPC, Cloud Load Balancing, Cloud CDN, Cloud DNS, Cloud Armor, Cloud NAT), Big Data (BigQuery, Dataflow, Pub/Sub, Dataproc, Data Fusion), AI/ML (Vertex AI, AutoML, Vision AI, Natural Language AI), and several more categories. Google's naming convention for icons uses the product name without a "Google Cloud" prefix in the icon files themselves. The file might be named "cloud_sql.svg" or "bigquery.svg" rather than "Google_Cloud_BigQuery.svg". This is simpler than AWS naming but means you need to know the short name, not the full marketing name, when searching manually. GCP diagrams use project boundaries as the primary grouping construct, which differs from AWS (account/VPC) and Azure (subscription/resource group). Within a project, the VPC provides the network boundary. Google recommends showing the Organization, Folder, and Project hierarchy when governance is relevant, and just the VPC structure when the diagram focuses on networking. One GCP-specific convention: Google publishes reference architecture diagrams that use a specific visual style with light gray backgrounds for boundaries, blue fill for GCP services, and white fill for external services. Arrows use a consistent style with protocol labels. Diagrams.so follows these conventions when GCP is selected as the cloud provider, producing output that visually matches Google's own architecture center diagrams. The icon set updates when Google launches or renames services. AlloyDB, Cloud Run Jobs, and Assured Workloads are relatively recent additions. Google's pace of service launches is slower than AWS, which means the icon set is more stable year to year, but it still changes enough that a two-year-old icon library will be missing some current services.
Oracle OCI diagram toolkit: formats, .drawio native support, and unique characteristics
Oracle publishes an OCI Architecture Diagram Toolkit that stands apart from other cloud providers in one significant way: it includes native .drawio templates alongside the SVG icons. AWS, Azure, and GCP publish icon sets that you import into Draw.io. Oracle publishes complete .drawio files with pre-built reference architecture templates. This means OCI has the closest alignment with the Draw.io ecosystem of any cloud provider. The toolkit contains SVG icons for every OCI service, organized by category: Compute, Networking, Storage, Database, Security, Governance, Developer Services, Observability and Management, AI and Machine Learning, and Analytics. The icons use Oracle's red-and-dark color scheme. Unlike the blue-dominant palette shared by AWS, Azure, and GCP, Oracle's red accent makes OCI components immediately distinguishable in multi-cloud diagrams where services from different providers appear together. Oracle's icon naming follows the format "OCI_[ServiceName]". For example, "OCI_Compute_VM" for a virtual machine, "OCI_Autonomous_Database" for ADB, "OCI_VCN" for Virtual Cloud Network. The names are short and match the console labels, which makes searching the library straightforward. The pre-built .drawio templates are the toolkit's standout feature. Oracle provides templates for common patterns: three-tier web application, hub-spoke networking, disaster recovery, data analytics pipeline, and more. Each template uses official icons, correct boundary nesting (tenancy, compartment, VCN, subnet), and labeled connections. You can open a template in Draw.io and modify it for your specific architecture. Diagrams.so goes beyond templates by generating custom diagrams from your specific prompt, but the templates are useful as reference for what a well-structured OCI diagram should look like. OCI diagrams have unique boundary requirements. The compartment is OCI's primary organizational unit, and it appears as a container in every OCI diagram. Inside compartments, VCNs provide network boundaries, and inside VCNs, subnets divide the address space into public and private segments. This three-level nesting (compartment > VCN > subnet) is deeper than AWS (VPC > subnet) or Azure (resource group > VNet > subnet), and getting it right in the diagram communicates understanding of OCI's governance model. The toolkit updates alongside OCI service launches, though less frequently than AWS. Oracle typically updates twice a year. The current version includes icons for newer services like OCI Container Instances, OCI DevOps, OCI Functions, and OCI Data Science.
How Diagrams.so handles icon selection automatically across 30+ libraries
Manual icon selection is the bottleneck that kills diagramming productivity. You know the architecture. You know what goes where. But spending 15 minutes per diagram searching for the right icon, downloading it, importing it into Draw.io, and placing it at the right size adds up. For a team that produces 20 diagrams a month, that's five hours of icon hunting. Diagrams.so eliminates this step with automatic icon selection based on RULE-02: use official cloud provider icons. When you write a prompt, the AI identifies service names and maps each one to the correct icon from the selected provider's library. The mapping handles common variations: "S3" and "Amazon S3" and "S3 bucket" all resolve to the same AWS S3 icon. "Azure SQL" and "Azure SQL Database" and "SQL Database" all resolve to the Azure SQL Database icon when Azure is the selected provider. The mapping also handles cross-provider awareness. If your prompt mentions services from multiple clouds (a multi-cloud architecture), the AI loads icons from all relevant libraries simultaneously. An EKS cluster icon from AWS, an Azure AD icon from Azure, and a BigQuery icon from GCP can coexist in the same diagram with each icon drawn from its provider's official set. Icon sizing follows each provider's guidelines. AWS service icons render at 48x48 pixels by default. Group icons (VPC, subnet, region) render at the size needed to contain their children. The AI calculates container sizes based on the number of contained components and applies padding that matches each provider's recommended spacing. When a service name is ambiguous, Diagrams.so triggers WARN-05 (Ambiguous component). If you write "a load balancer" in a prompt with AWS selected, it could mean Application Load Balancer, Network Load Balancer, Gateway Load Balancer, or Classic Load Balancer. The warning prompts you to be specific. Write "Application Load Balancer" and the ambiguity resolves. This is a feature of the architecture warning system, not a limitation: it pushes you toward the specificity that produces accurate diagrams. The 30+ icon libraries include all four major cloud providers (AWS, Azure, GCP, OCI) plus generic technology icons for Kubernetes, Docker, Terraform, databases (PostgreSQL, MySQL, MongoDB, Redis), message brokers (Kafka, RabbitMQ), monitoring tools (Prometheus, Grafana), and CI/CD platforms (GitHub Actions, GitLab CI, Jenkins). This coverage means that most architectures can be diagrammed without any manual icon importing. Icon updates happen on the Diagrams.so side. When AWS releases a new icon set or Azure renames a service, the library updates without any action from you. This is a meaningful advantage over maintaining local icon libraries in Draw.io, where someone has to download the new package, import it, and distribute it to the team every time a provider updates their icons.
Common icon mistakes in architecture diagrams and how to avoid them
After reviewing thousands of architecture diagrams, seven icon mistakes appear repeatedly. Each one reduces the diagram's usefulness and each one is avoidable. Mistake 1: Using outdated icons. Cloud providers update icons when services are renamed or redesigned. The old Azure Active Directory shield icon is still used in diagrams created this year, even though the service is now Microsoft Entra ID with a different icon. Fix: use current icon sets. Diagrams.so keeps its libraries updated, so this mistake is eliminated automatically. Mistake 2: Using the wrong icon level. AWS has service icons and resource icons. A diagram that uses the EC2 service icon to represent a specific EC2 instance is technically wrong. The service icon represents the EC2 service itself. A resource icon represents a specific instance. In practice, most architecture diagrams use service icons for everything, and that's acceptable at the system architecture level. Resource icons matter in deployment diagrams where you're showing specific instance types and counts. Fix: match icon level to diagram abstraction level. Mistake 3: Mixing icon sets from different years or sources. A diagram with the 2020 RDS icon next to the 2024 Lambda icon looks inconsistent. Reviewers may not consciously notice the mismatch, but it creates a subtle impression of carelessness. Fix: use a single consistent icon set version across all diagrams. Diagrams.so uses a single version of each provider's library, so this inconsistency cannot occur in generated diagrams. Mistake 4: Stretching or distorting icons to fill space. When a component seems "more important," architects sometimes make its icon larger. This breaks the visual grammar of the diagram. A 96x96 EC2 icon next to a 48x48 RDS icon implies that compute is more important than the database, which is not an architectural statement you intended to make. Fix: keep icons at their standard size. Use boundary containers and labels to communicate importance. Mistake 5: Using generic icons when specific ones exist. A generic database cylinder for DynamoDB, a generic server for Lambda, a generic cloud for CloudFront. Each of these services has a unique official icon that communicates its specific characteristics. Fix: always use the most specific icon available. Diagrams.so maps service names to specific icons, so WARN-05 fires when your prompt is too vague to resolve to a specific icon. Mistake 6: Forgetting group boundaries. Icons floating in whitespace without VPC, subnet, project, or compartment boundaries lose their deployment context. A Lambda function connected to an RDS database tells you the logical relationship but not the network path. Wrapping them in VPC and subnet boundaries adds the physical network context. Fix: always include at least one level of grouping in your prompt. Mistake 7: Using icons from a different cloud provider. An Azure SQL icon used in an AWS diagram because it "looked like a database." A GCP Cloud Functions icon used in an Azure diagram because the architect couldn't find the Azure Functions icon. This creates outright misinformation in the diagram. Fix: select the correct cloud provider in Diagrams.so. The AI only uses icons from the selected provider's library, making cross-provider icon confusion impossible.
Related diagrams from the gallery


Try these diagram generators
Make Any Diagram from Text with AI
Describe your system, process, or data flow in plain English. Get a valid Draw.io diagram with correct symbols, aligned nodes, and exportable .drawio XML.
Generate AWS architecture diagrams from text
Describe your AWS infrastructure in plain English. Get a valid Draw.io diagram with official AWS icons, VPC boundaries, and Multi-AZ placement.
Generate Azure Architecture Diagrams from Text with AI
Describe your Azure infrastructure in plain English. Get a valid Draw.io diagram with official Azure icons, VNet boundaries, resource groups, and NSG rules.