
Convert JSON to a diagram
Paste a JSON structure — infrastructure, a service map, or config — and get a native, editable .drawio diagram with the entities and relationships drawn for you.
To convert JSON to a diagram with Diagrams.so, paste your JSON and the AI reads its structure — the keys, the nesting, and the references between objects — to infer the entities and how they connect, then renders them as a native .drawio diagram with the right icons and an editable layout. It works best on JSON that describes a system, such as a CloudFormation or CDK output, a Kubernetes manifest, a serverless config, or a custom service map, and it returns a real editable file rather than a static image, so you can rearrange it, add components, and export to PNG or SVG.
What you get with Diagrams.so
Text-to-diagram
Describe or paste your source in plain English and get a diagram back in seconds.
Native .drawio export
Output is real mxGraphModel XML that opens and stays editable in Draw.io.
30+ icon libraries
Official AWS, Azure, GCP, and Kubernetes icon sets, auto-selected per service.
Architecture warnings
Best-practice checks flag issues like single-AZ or public exposure, with one-click fixes.
Community gallery
Browse, fork, and remix real architecture diagrams to start from a proven pattern.
Voice-to-diagram
Dictate an architecture out loud and watch it render — available on every plan.
How to convert JSON to a diagram
- 1
Paste your JSON
Drop in the JSON that describes your system — an infrastructure template, a list of services and their dependencies, a Kubernetes manifest, or a config object. There is nothing to install, and the diagram is built from the text you paste, not from a live environment.
- 2
The AI infers entities and links
Object keys and types become nodes, arrays express multiplicity, and references between objects — an id, a name, a field like dependsOn or routesTo — become the connections, so the diagram reflects how the pieces actually relate rather than just the raw tree.
- 3
Icons and grouping are applied
Where a node maps to a known service — a DynamoDB table, a Lambda function, an API gateway — it is drawn with the official cloud icon, and related objects are grouped so the structure is legible at a glance.
- 4
Review and refine
Check that every object you care about appears and that the connections match your intent. Because the diagram is editable, anything the JSON left implicit — a boundary, a label, an extra dependency — you add directly on the canvas.
- 5
Edit and export the .drawio
Rearrange, restyle, or extend the diagram, then download the native .drawio file or export to PNG or SVG. It opens in Draw.io desktop, the VS Code extension, and Confluence with no conversion.
Worked example
JSON (service map)
{
  "services": [
    { "name": "api", "type": "APIGateway", "routesTo": ["auth", "orders"] },
    { "name": "auth", "type": "Lambda", "reads": ["users"] },
    { "name": "orders", "type": "Lambda",
      "reads": ["ordersTable"], "publishes": ["order-events"] }
  ],
  "datastores": [
    { "name": "users", "type": "DynamoDB" },
    { "name": "ordersTable", "type": "DynamoDB" }
  ]
}
Resulting diagram
An API Gateway node routes to two Lambda functions, auth and orders. The auth function reads a DynamoDB users table; the orders function reads a DynamoDB orders table and publishes to an order-events topic. Each service is drawn with its official AWS icon, the reads and routesTo references become labelled arrows, and the whole diagram is editable — drag a node, add an SQS queue, or draw a boundary around the data tier, then export it as .drawio, PNG, or SVG.
What kinds of JSON make good diagrams
JSON is a general format, so the useful question is not whether it can be drawn but what the drawing should mean. The strongest results come from JSON that already describes a system. Infrastructure definitions — a CloudFormation template, the output of a CDK synth, a Terraform plan exported to JSON, a Kubernetes manifest, or a serverless framework config — carry resources and their relationships explicitly, and those map cleanly onto an architecture diagram. A custom service map, where each entry lists a service and its dependencies, works just as well. API schemas and OpenAPI documents can become structural diagrams of resources and their shapes. For arbitrary data JSON that does not describe a system, the conversion produces a structure or tree diagram of the nesting, which is useful for understanding an unfamiliar payload even if it is not an architecture. Knowing which of these you have helps you read the first draft: an infrastructure JSON should look like an architecture, while a data payload should look like a tree.
How the AI reads structure and relationships
The conversion works from the shape of the document. Keys and type fields tell it what each node is and which icon to use; nesting tells it what contains what; arrays tell it how many of a thing exist; and cross-references — an id used elsewhere, a name in a dependsOn list, a field like routesTo or reads — tell it what connects to what. That reference-following is what turns a flat tree into a real diagram of relationships rather than a literal outline of the JSON. What it cannot infer is anything the JSON does not contain: a dependency expressed only in code, a boundary that exists by convention, or the meaning of an opaque identifier. Because this is an AI interpretation rather than a fixed schema parser, treat the first draft as a strong starting point — confirm the entities you expect are present, check that the connections match your intent, and add anything implicit directly. For system-describing JSON the draft is usually close enough to edit rather than rebuild.
From JSON to an editable .drawio you own
The output is native mxGraphModel XML, the same format Draw.io uses, not a screenshot or a proprietary export. That matters when the JSON comes from your infrastructure, because the diagram can live in the same repository, be updated when the config changes, and be reviewed in a pull request like any other file. You can commit the .drawio, embed it in a README or Confluence page, or hand it to a teammate who edits it in the free Draw.io desktop app with no account. Once it is on an editable canvas you can add official AWS, Azure, GCP, and Kubernetes icons, draw VPC or namespace boundaries around groups, run the architecture warnings engine to catch issues, and export a clean image for a deck or a runbook. And because the same engine also generates from plain English, you can sketch a target design that way before the JSON for it exists, then compare the two.
Example diagrams from the gallery


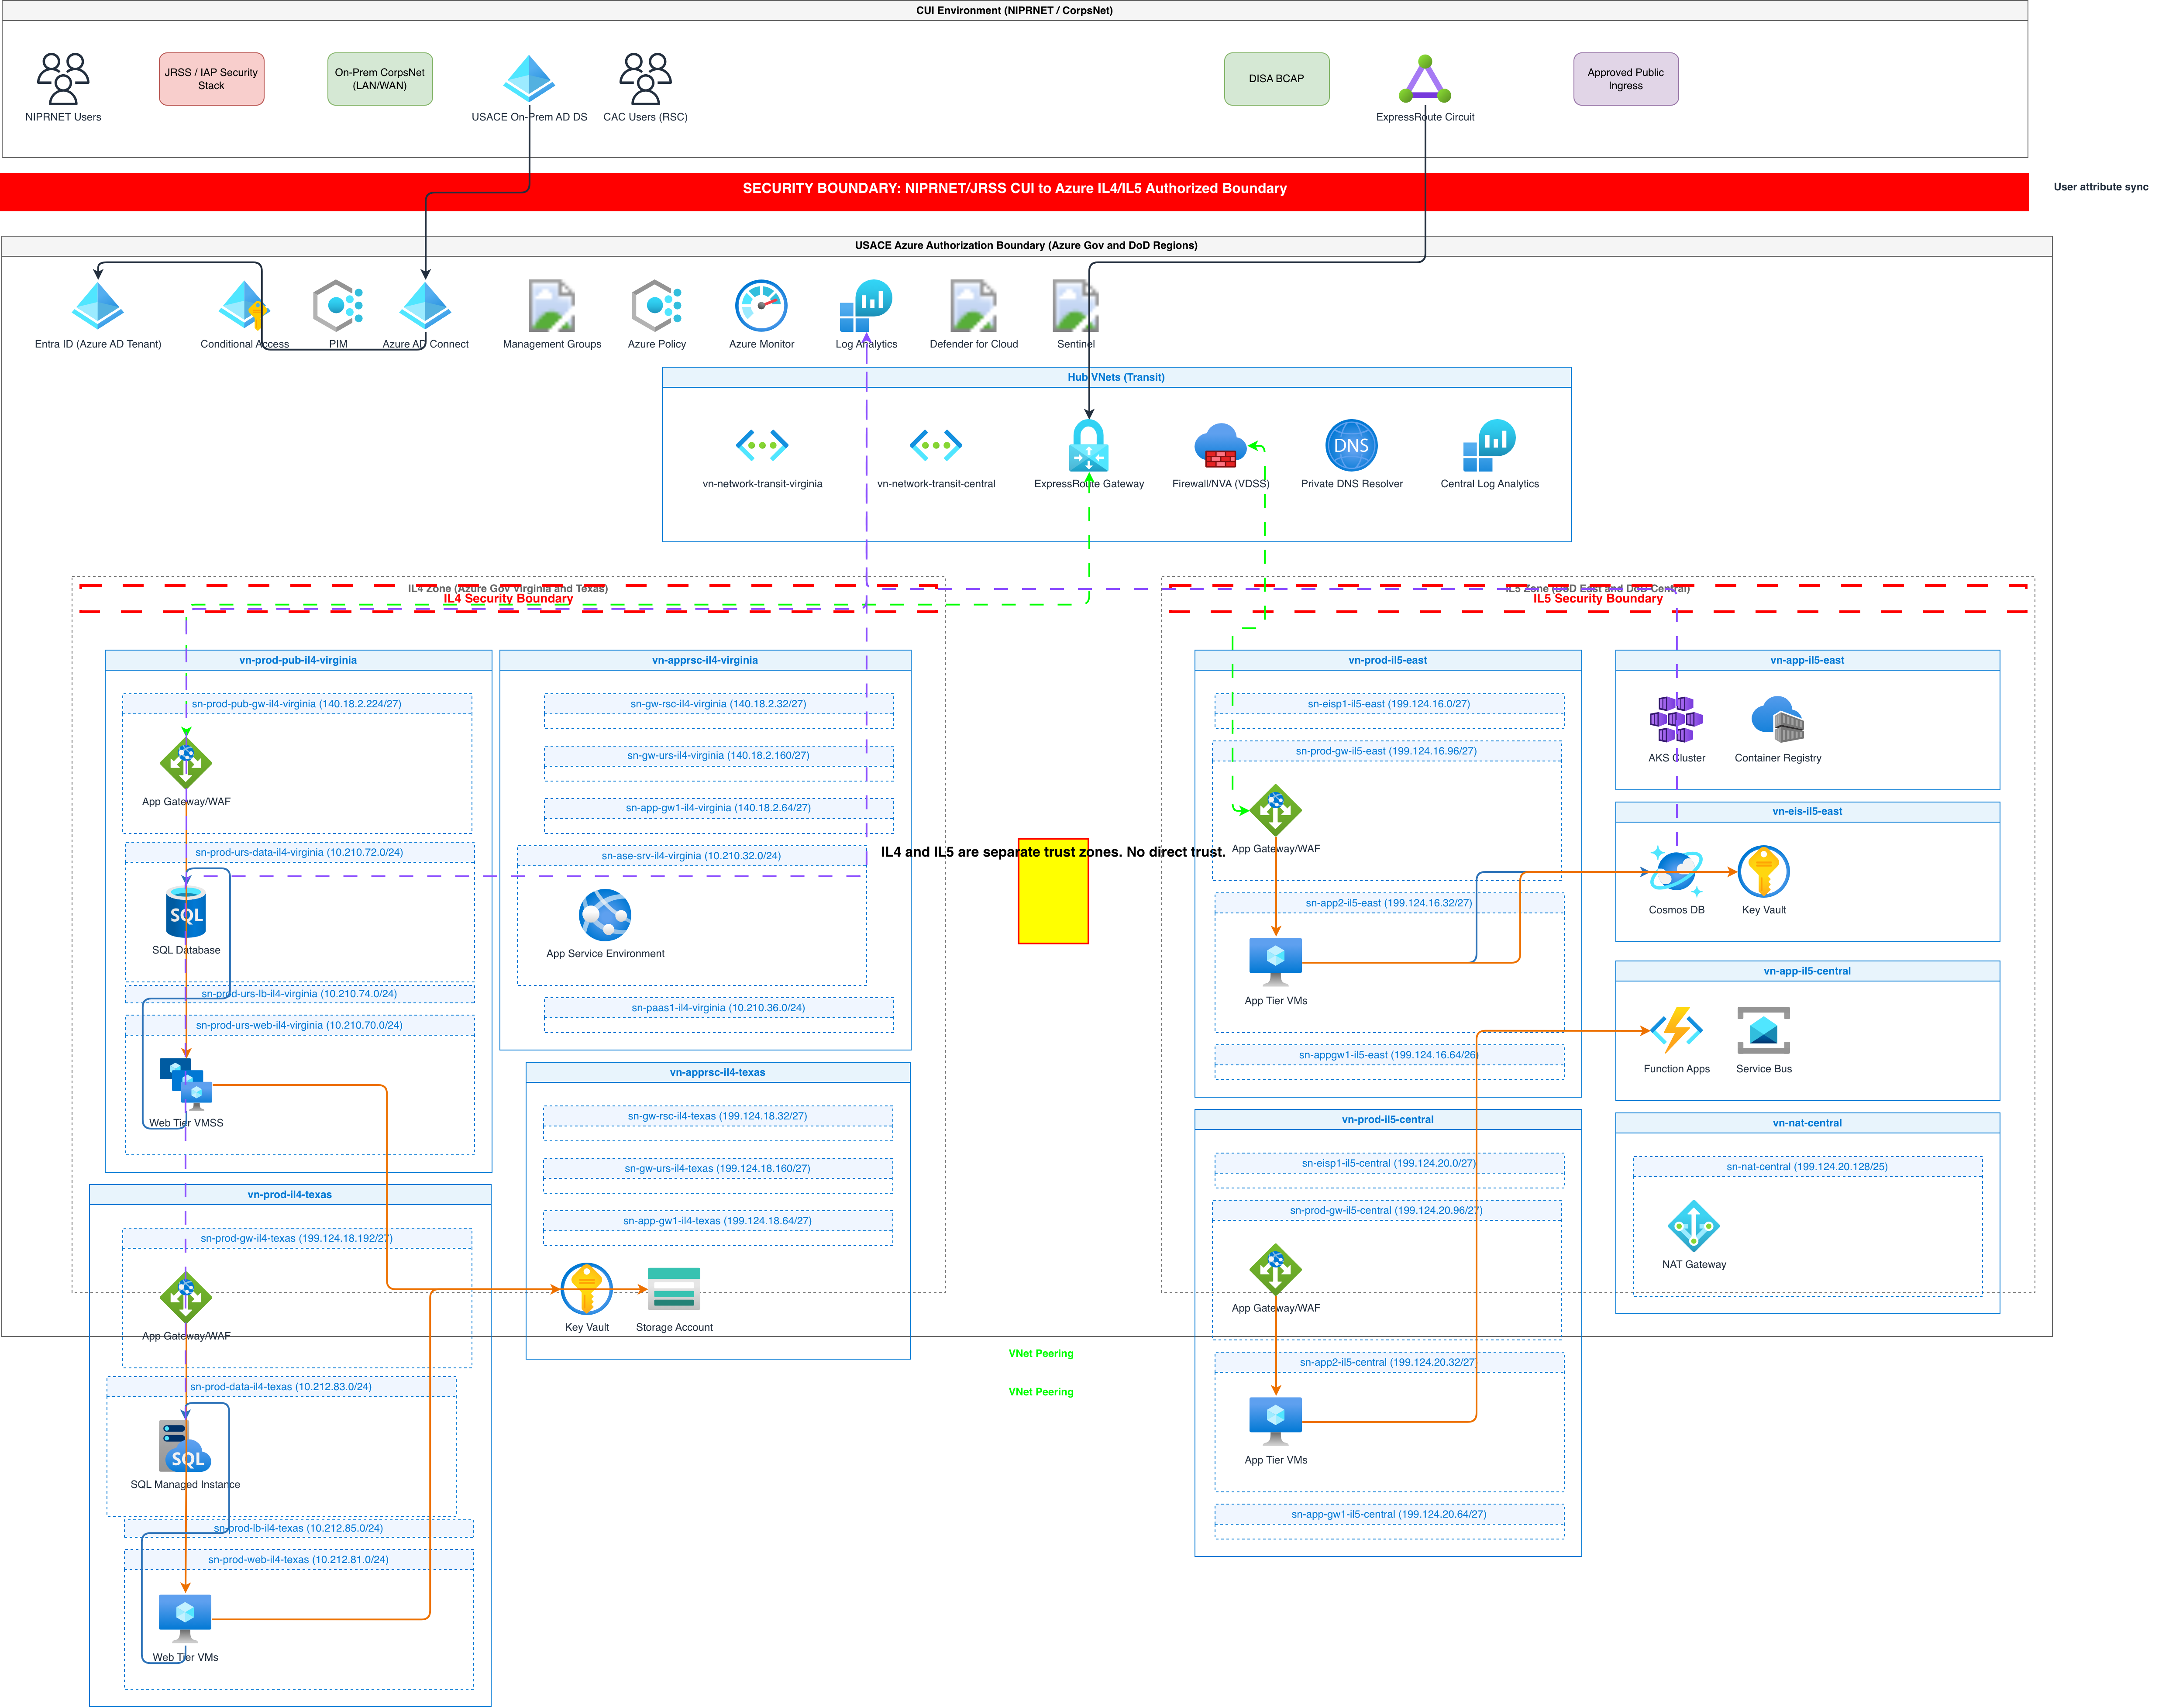

Diagrams.so vs manual drawing and JSON tree viewers
There is more than one way to visualise JSON. The choice depends on whether you want a literal tree of the data or an architecture diagram of the system it describes, and whether you need to edit the result.
| Feature | Diagrams.so | JSON tree viewer | Manual (Draw.io) |
|---|---|---|---|
| Reads references between objects | Yes, builds real connections | No, shows literal nesting | You decide them |
| Output | Editable .drawio | Read-only tree | Editable .drawio |
| Cloud icons | Official AWS/Azure/GCP/K8s | None | You place them |
| Architecture warnings | Built-in | None | None |
| Speed | Seconds | Instant but literal | Slow |
Frequently asked questions
What JSON works best for this?
JSON that describes a system: a CloudFormation or CDK output, a Kubernetes manifest, a serverless config, or a service map that lists services and their dependencies. Arbitrary data JSON is drawn as a structure or tree diagram of its nesting instead of an architecture.
Does it just draw the JSON tree, or the relationships?
It follows references between objects — ids, names, and fields like dependsOn or routesTo — to build real connections, so the result reflects how components relate rather than only the literal nesting. You can adjust any connection on the canvas.
Is the output editable?
Yes. It is a native .drawio (mxGraphModel XML) file, so you can drag nodes, regroup them, add components, and relabel, then export to PNG or SVG. It opens in Draw.io desktop, the VS Code extension, and Confluence.
Can I paste a CloudFormation or Kubernetes file?
Yes. Infrastructure JSON such as a CloudFormation template or a Kubernetes manifest carries resources and relationships explicitly, which maps cleanly onto an architecture diagram with the correct cloud icons.
How accurate is the conversion?
For system-describing JSON it reconstructs the entities and connections well enough to edit rather than rebuild. Because it is an AI interpretation, review the first draft: confirm the entities you expect are present and add anything the JSON left implicit.
Do I need to send my live environment or credentials?
No. The diagram is built from the JSON text you paste, not from any live account, so no credentials are involved and nothing is accessed or provisioned.