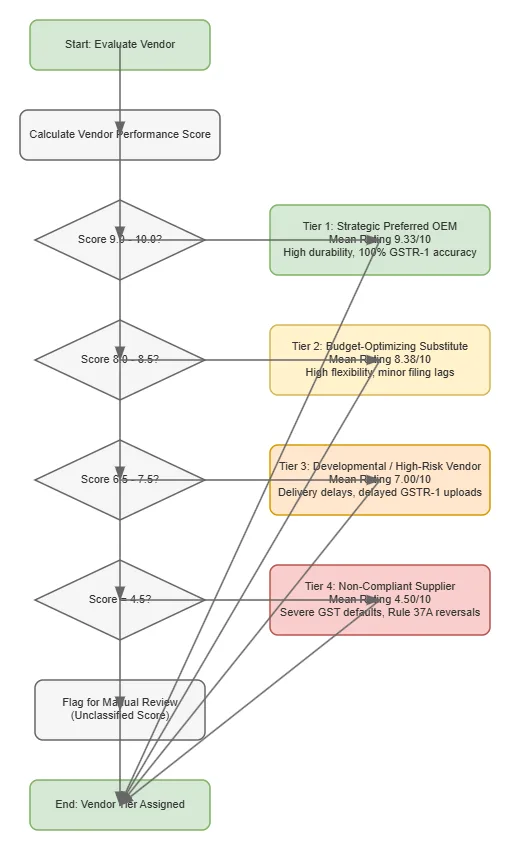
Vendor Performance Tier Classification Flowchart architecture diagram

About This Architecture

Vendor Performance Tier Classification Flowchart automates the segmentation of suppliers into four tiers based on calculated performance scores ranging from 4.5 to 10.0. The flowchart evaluates vendors through sequential score thresholds, classifying them as Strategic Preferred OEM (9.0–10.0), Budget-Optimizing Substitute (8.0–8.5), Developmental/High-Risk (6.5–7.5), or Non-Compliant Supplier (≤4.5), with GST compliance and delivery metrics factored into ratings. This tiered approach enables procurement teams to align vendor relationships with business risk tolerance and cost optimization goals while flagging unclassified scores for manual review. Fork and customize this flowchart on Diagrams.so to integrate your own scoring criteria, compliance rules, or organizational vendor governance policies.

People also ask

How do I classify vendors into performance tiers based on scoring and compliance?

This flowchart automates vendor classification by evaluating performance scores and routing suppliers into four tiers: Strategic Preferred OEM (9.0–10.0), Budget-Optimizing Substitute (8.0–8.5), Developmental/High-Risk (6.5–7.5), and Non-Compliant Supplier (≤4.5). GST compliance and delivery metrics inform the ratings, with unclassified scores flagged for manual review.

Vendor Performance Tier Classification Flowchart

Autointermediateprocurementvendor-managementsupply-chainrisk-assessmentcompliance
Domain: OtherAudience: procurement managers and supply chain analysts evaluating vendor performance
1 views0 favoritesPublic

Created by

August 11, 2026

Updated

August 12, 2026 at 11:59 AM

Type

flowchart

Need a custom architecture diagram?

Describe your architecture in plain English and get a production-ready Draw.io diagram in seconds. Works for AWS, Azure, GCP, Kubernetes, and more.

Generate with AI

AI-generated. Verify before production use. Learn more

Report this diagram