Technical Debt Spiral System Dynamics
About This Architecture
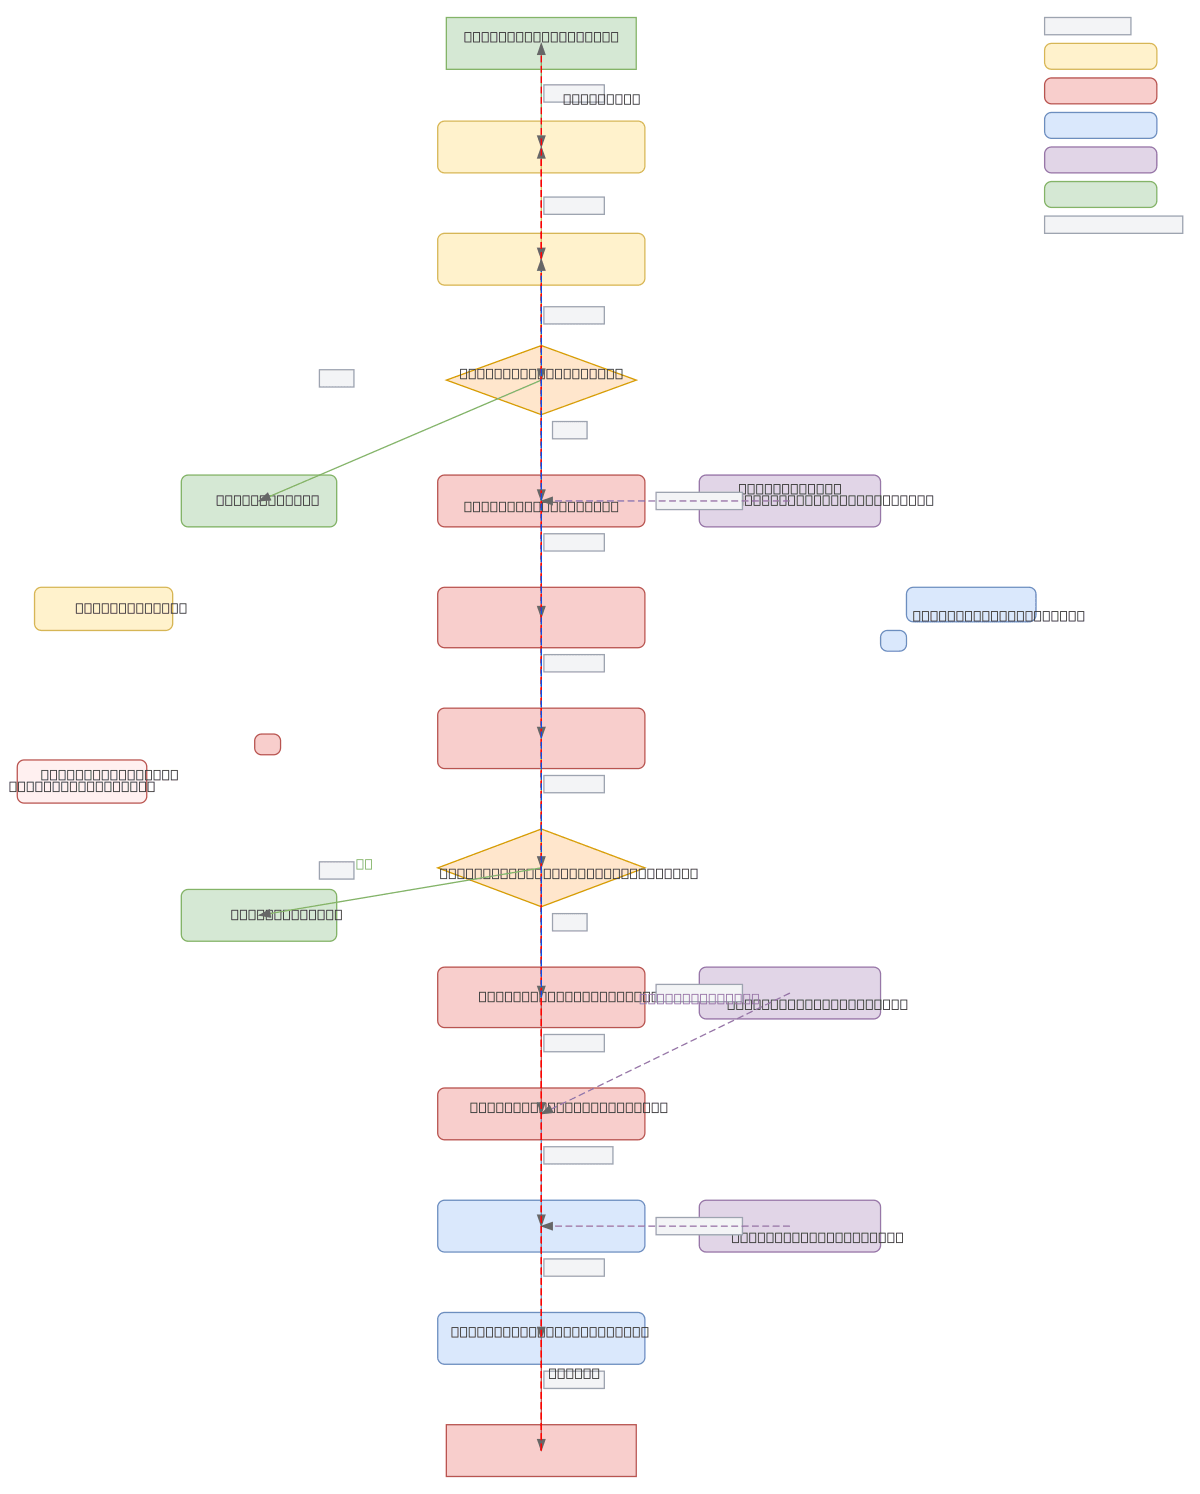
System dynamics model revealing how market competition and feature pressure create a reinforcing technical debt spiral in software teams. Market demand drives feature backlogs, which compress developer time and incentivize shortcuts that accumulate as technical debt, increasing code complexity and deployment failures. The diagram maps three intervention levers—refactoring time allocation, increased dev capacity, and reduced feature scope—that break the debt cycle and restore application stability. Fork this diagram to customize intervention strategies for your team's constraints, or embed it in engineering playbooks to communicate the cost of shortcuts to stakeholders.
People also ask
How does technical debt accumulate in software teams and what interventions can break the debt spiral?
This system dynamics diagram shows how market competition drives feature backlogs, creating time pressure that incentivizes shortcuts and technical debt accumulation. Three interventions—refactoring time allocation, increased dev capacity, and reduced feature scope—interrupt the reinforcing debt spiral and restore application stability by reducing complexity and deployment failures.
- Domain:
- Devops Cicd
- Audience:
- engineering leaders and technical managers overseeing software delivery and technical debt management
Generated by Diagrams.so — AI architecture diagram generator with native Draw.io output. Fork this diagram, remix it, or download as .drawio, PNG, or SVG.