SNCC Substation Control System Flowchart
About This Architecture
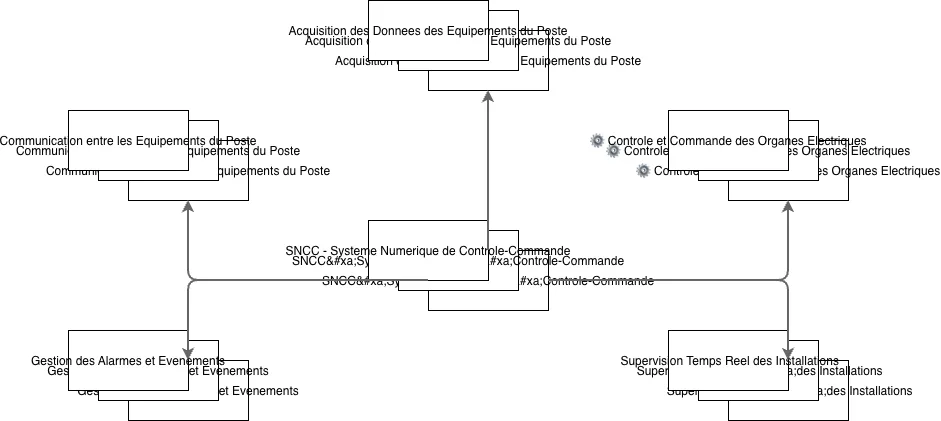
SNCC substation control system flowchart orchestrates real-time monitoring and automated command execution across field equipment including sensors, relays, and circuit breakers. Data acquisition from field devices triggers alarm detection and event management, with supervisory logic determining whether control actions or commands are required on electrical organs. Communication between substation equipment and transmission to the central SNCC control center completes each surveillance cycle, enabling operators to maintain grid stability and respond to faults. Fork this diagram on Diagrams.so to customize alarm thresholds, add redundancy paths, or integrate with your SCADA infrastructure. The cyclic architecture ensures continuous monitoring with graceful retry logic when data acquisition fails.
People also ask
How does an SNCC substation control system manage real-time monitoring and automated command execution across field equipment?
The SNCC flowchart cycles through data acquisition from sensors, relays, and circuit breakers, detects alarms or events, triggers alarm management and real-time supervision, evaluates control requirements, executes commands on electrical organs, and communicates status to the central control center before restarting surveillance.
- Domain:
- Electrical Engineering
- Audience:
- electrical engineers and substation control system operators managing SNCC digital control systems
Generated by Diagrams.so — AI architecture diagram generator with native Draw.io output. Fork this diagram, remix it, or download as .drawio, PNG, or SVG.