Smart Irrigation and Roof Control Flowchart
About This Architecture
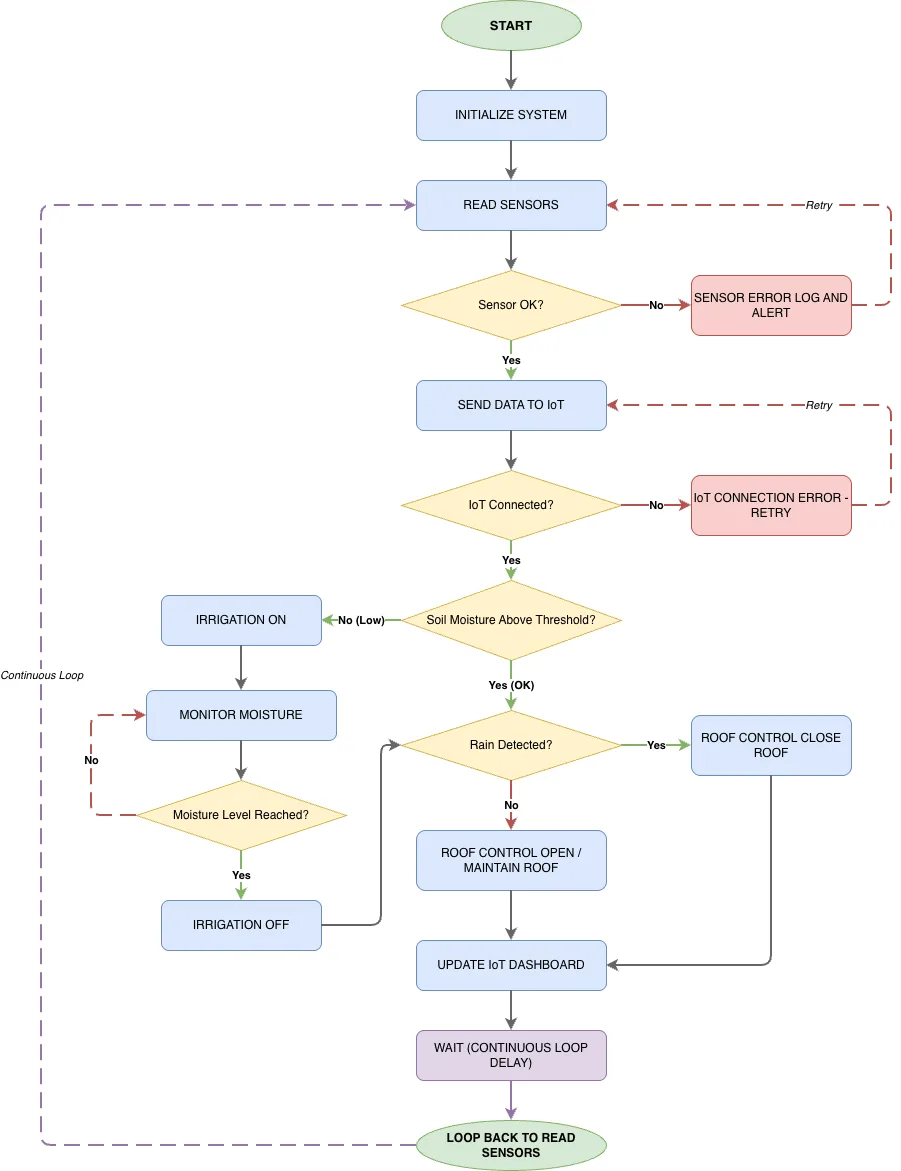
Smart irrigation and roof control flowchart orchestrates sensor reading, moisture threshold evaluation, and weather-responsive automation in a continuous loop. The system reads soil moisture and rain sensors, logs errors with IoT retry logic, and triggers irrigation or roof closure based on environmental conditions. This architecture demonstrates best practices for resilient IoT systems: sensor validation, connection error handling, and state-based control logic that adapts to real-time conditions. Fork this flowchart on Diagrams.so to customize sensor thresholds, add additional environmental triggers, or integrate with your specific IoT platform and dashboard. The continuous loop with delay ensures responsive automation while preventing resource exhaustion from rapid polling cycles.
People also ask
How do I design an IoT flowchart for automated irrigation that responds to soil moisture and rain detection?
This flowchart demonstrates a complete smart irrigation system: it continuously reads soil moisture and rain sensors, validates sensor data with error logging, sends data to IoT with connection retry logic, triggers irrigation when moisture is below threshold, monitors until target moisture is reached, and closes the roof during rain while maintaining it otherwise. The continuous loop with delay e
- Domain:
- Other
- Audience:
- IoT engineers and smart agriculture system designers implementing automated irrigation and environmental controls
Generated by Diagrams.so — AI architecture diagram generator with native Draw.io output. Fork this diagram, remix it, or download as .drawio, PNG, or SVG.