Qualified Intrusion Detection Data Flow
About This Architecture
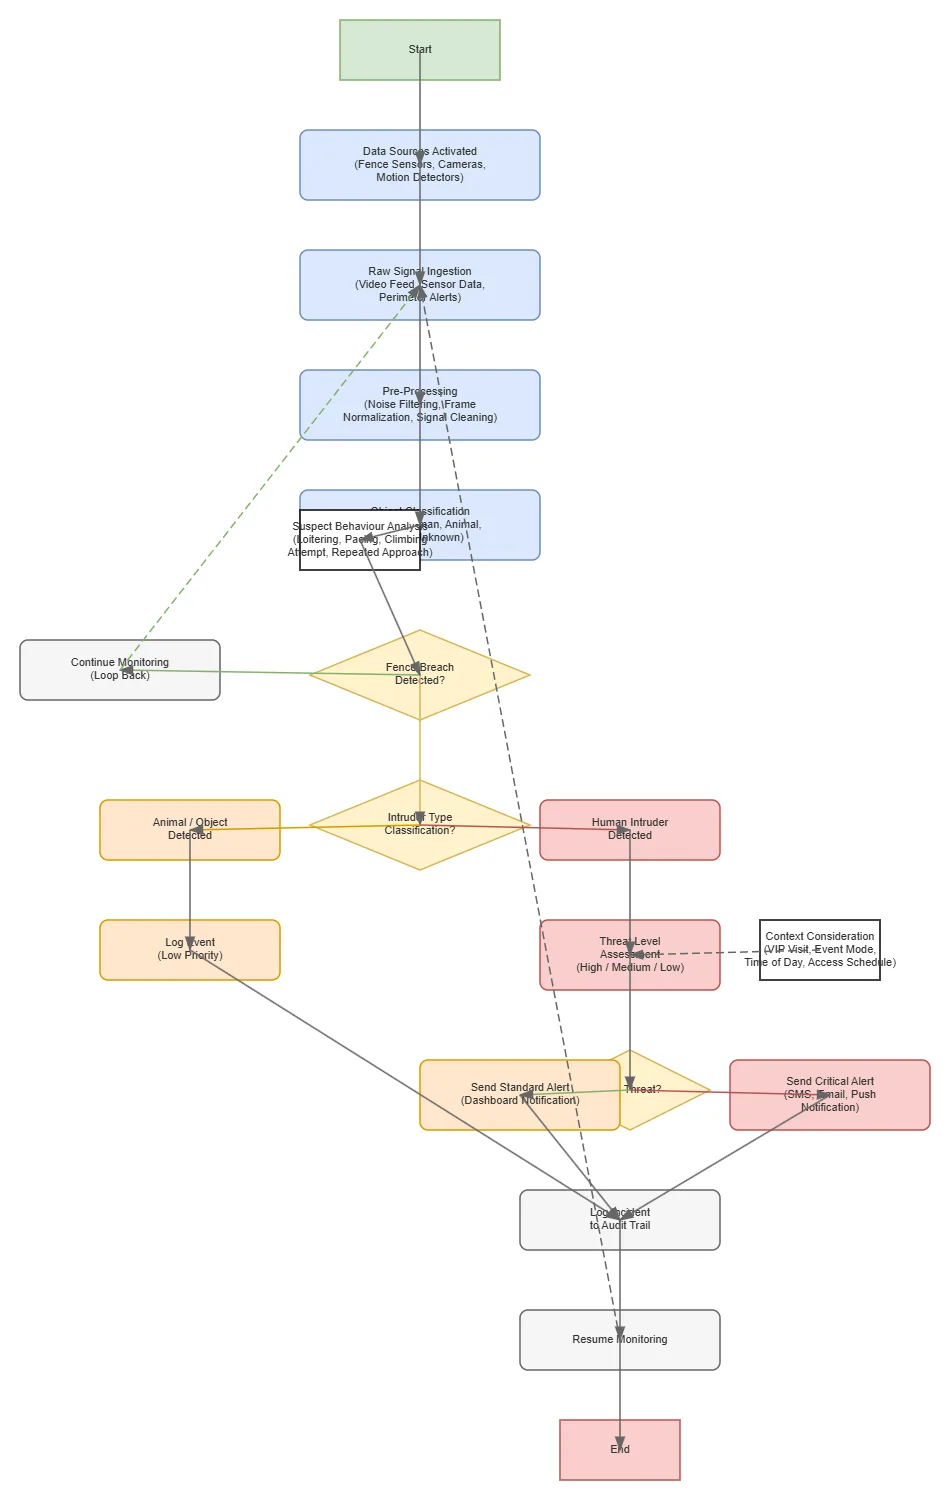
Qualified Intrusion Detection Data Flow orchestrates real-time threat classification from fence sensors, cameras, and motion detectors through multi-stage signal processing. Raw signals from video feeds and perimeter alerts flow through noise filtering and frame normalization before object classification distinguishes human intruders from animals or objects. Detected breaches trigger threat level assessment that routes high-priority incidents to SMS/email/push notifications while low-priority events log to the audit trail, enabling security teams to respond proportionally to actual threats. Fork this diagram on Diagrams.so to customize sensor types, alert channels, or threat classification logic for your facility. The loop-back architecture ensures continuous monitoring without alert fatigue from false positives.
People also ask
How does a qualified intrusion detection system process sensor data to distinguish real threats from false alarms?
This diagram shows a multi-stage pipeline: fence sensors, cameras, and motion detectors feed raw signals through noise filtering and frame normalization, then object classification identifies humans versus animals. Detected breaches undergo threat level assessment that routes high-priority incidents to SMS/email/push alerts while logging low-priority events, reducing alert fatigue.
- Domain:
- Security
- Audience:
- Security architects designing perimeter intrusion detection systems
Generated by Diagrams.so — AI architecture diagram generator with native Draw.io output. Fork this diagram, remix it, or download as .drawio, PNG, or SVG.