Prometheus + Grafana Stack
GENERALArchitecture
About This Architecture
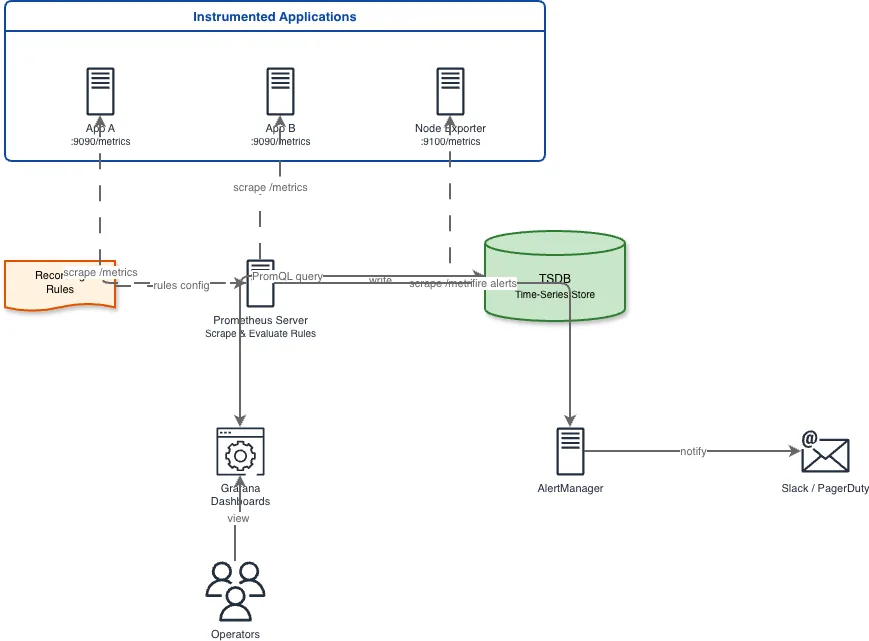
Metrics-based monitoring with instrumented applications exposing /metrics endpoints scraped by Prometheus Server, stored in a TSDB, visualized through Grafana dashboards, and AlertManager routing alerts to Slack and PagerDuty.
Architecture prompt
Metrics-based monitoring with instrumented applications exposing /metrics endpoints scraped by Prometheus Server, stored in a TSDB, visualized through Grafana dashboards, and AlertManager routing alerts to Slack and PagerDuty.
Generated by Diagrams.so — AI architecture diagram generator with native Draw.io output. Fork this diagram, remix it, or download as .drawio, PNG, or SVG.