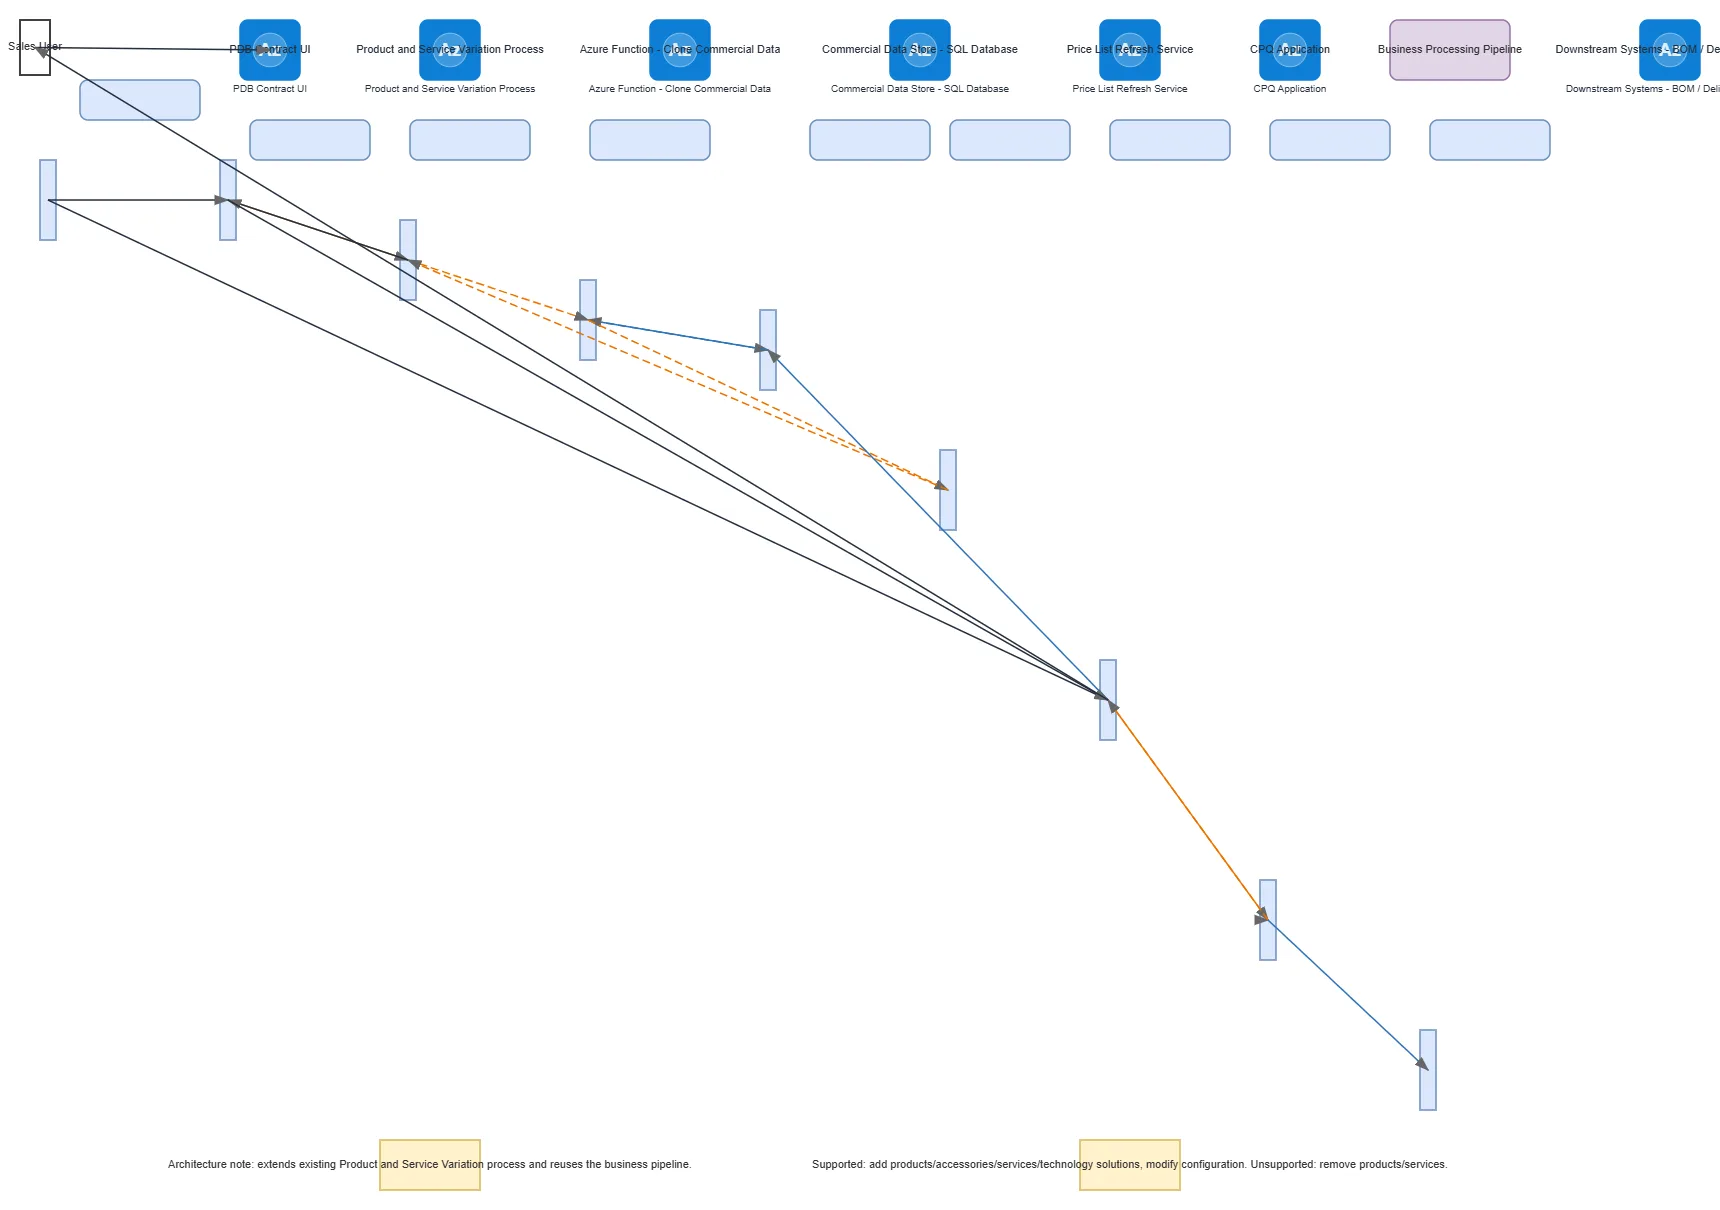
PDB Product and Service Variation Sequence — AZURE architecture diagram

About This Architecture

Product and Service Variation sequence on Azure orchestrates sales user requests through a PDB Contract UI into a multi-step commercial data processing pipeline. The workflow routes data through an Azure Function for cloning commercial data into a SQL Database, then triggers a Price List Refresh Service and CPQ Application for configuration and pricing updates. This architecture demonstrates how to extend existing product variation processes with serverless compute and managed databases, enabling sales teams to add products, accessories, services, and technology solutions while maintaining data consistency across downstream systems like BOM, delivery, and credit modules. Fork this diagram on Diagrams.so to customize the sequence for your organization's product catalog and pricing governance requirements.

People also ask

How do you design a product and service variation workflow on Azure that integrates CPQ with commercial data management?

This diagram shows a sequence where Sales Users submit requests through a PDB Contract UI, triggering an Azure Function to clone commercial data into SQL Database, then routing through a Price List Refresh Service and CPQ Application before synchronizing with downstream systems. This pattern ensures consistent product configuration and pricing governance across your sales and delivery processes.

PDB Product and Service Variation Sequence

AzureintermediateCPQProduct ConfigurationServerlessSQL DatabaseWorkflow Orchestration
Domain: Cloud AzureAudience: Azure solutions architects designing product configuration and pricing workflows
1 views0 favoritesPublic

Created by

July 30, 2026

Updated

August 9, 2026 at 3:36 PM

Type

architecture

Need a custom architecture diagram?

Describe your architecture in plain English and get a production-ready Draw.io diagram in seconds. Works for AWS, Azure, GCP, Kubernetes, and more.

Generate with AI

AI-generated. Verify before production use. Learn more

Report this diagram