OCI Multi-Agent Platform Architecture: OCI architecture diagram

About This Architecture

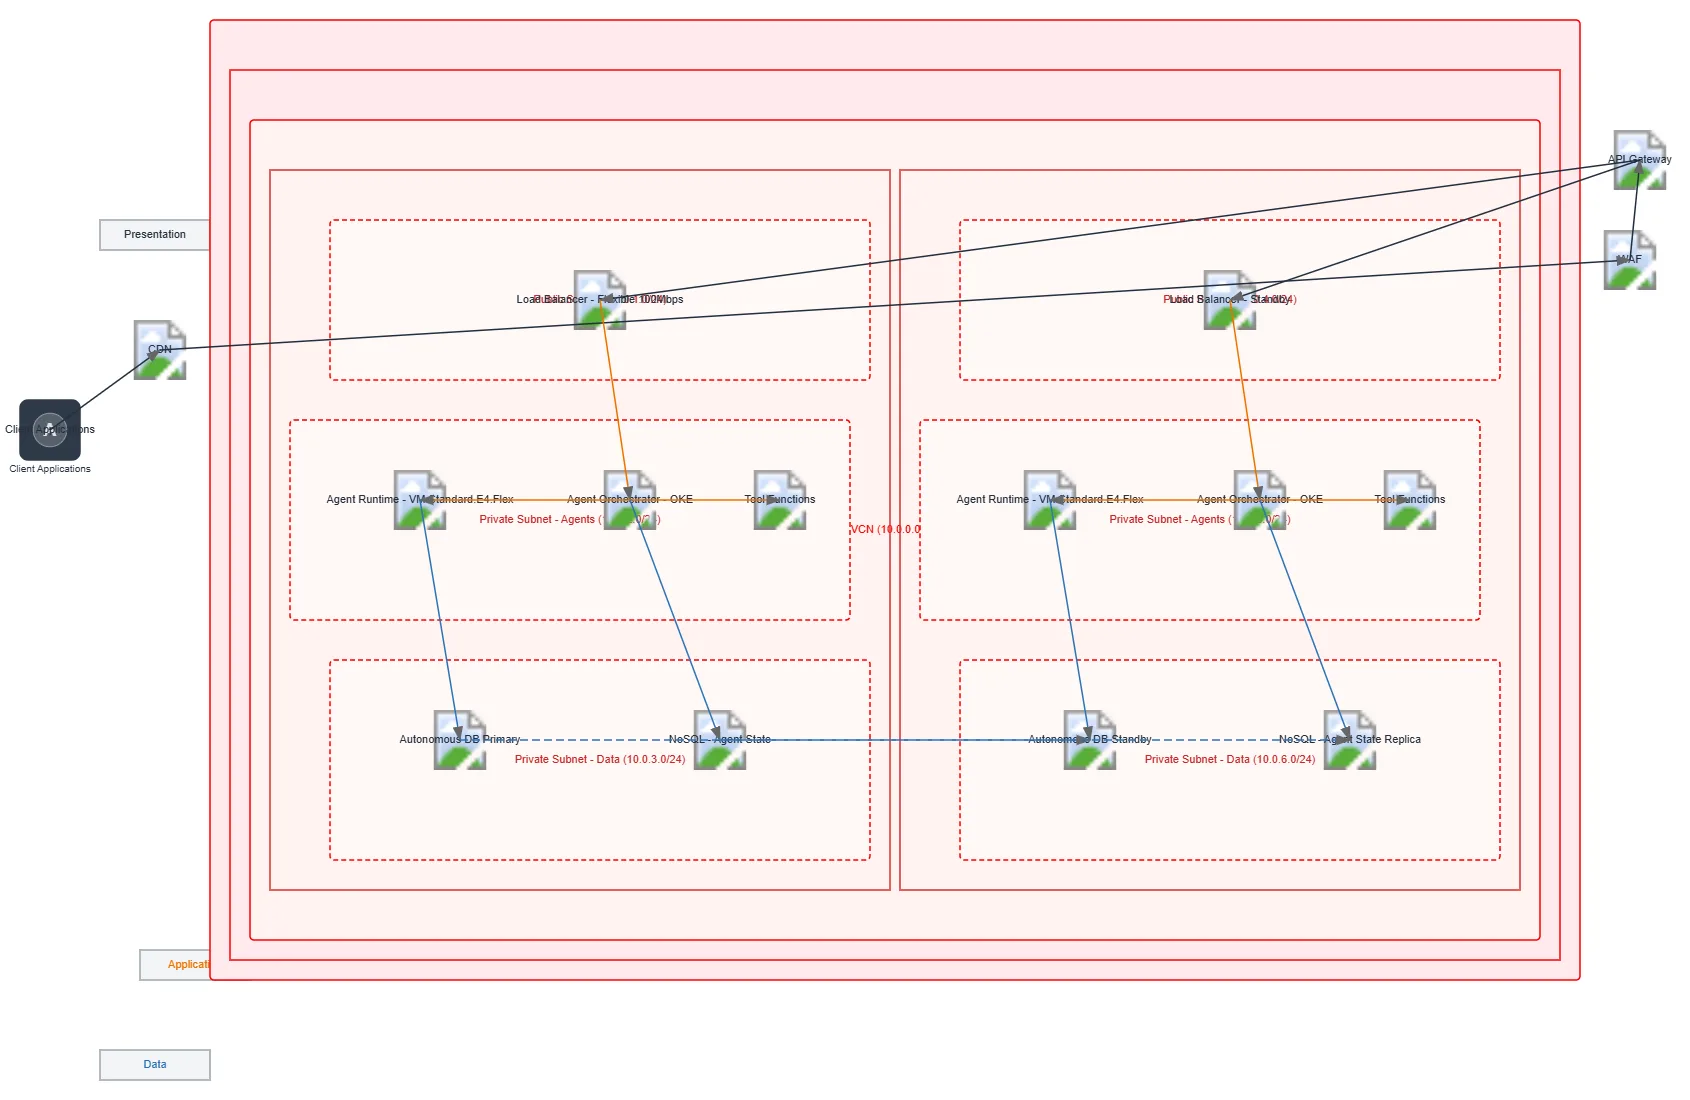
Multi-agent AI platform on OCI with active-active failover across two availability domains, leveraging OKE for orchestration and VM.Standard.E4.Flex for agent runtimes. Client requests flow through CDN, WAF, and API Gateway to load-balanced OKE clusters, which orchestrate Agent Runtime instances and Tool Functions while synchronizing state across Autonomous DB Primary/Standby and NoSQL replicas. This architecture delivers high availability and disaster recovery for production AI workloads with zero single points of failure. Fork this diagram on Diagrams.so to customize agent configurations, adjust instance types, or modify subnet CIDR ranges for your deployment. The dual-region design with Data Guard replication ensures RTO/RPO targets for mission-critical agent applications.

People also ask

How do I design a highly available multi-agent AI platform on OCI with automatic failover and data replication?

This diagram shows an OCI multi-agent platform spanning two availability domains with OKE-orchestrated Agent Runtimes, Autonomous DB Primary/Standby replication, and NoSQL agent state replicas. Client traffic routes through CDN, WAF, and API Gateway to load-balanced OKE clusters that manage agent lifecycle and synchronize state, ensuring zero data loss and continuous availability during regional f

OCI Multi-Agent Platform Architecture

OCIadvancedMulti-Agent AIOKE KubernetesHigh AvailabilityDisaster RecoveryAutonomous Database
Domain: Cloud OciAudience: OCI solutions architects designing multi-agent AI platforms
2 views0 favoritesPublic

Created by

October 7, 2026

Updated

October 21, 2026 at 12:08 AM

Type

architecture

Make your own

View all OCI diagrams

Need a custom architecture diagram?

Describe your architecture in plain English and get a production-ready Draw.io diagram in seconds. Works for AWS, Azure, GCP, Kubernetes, and more.

Generate with AI

AI-generated. Verify before production use. Learn more

Report this diagram