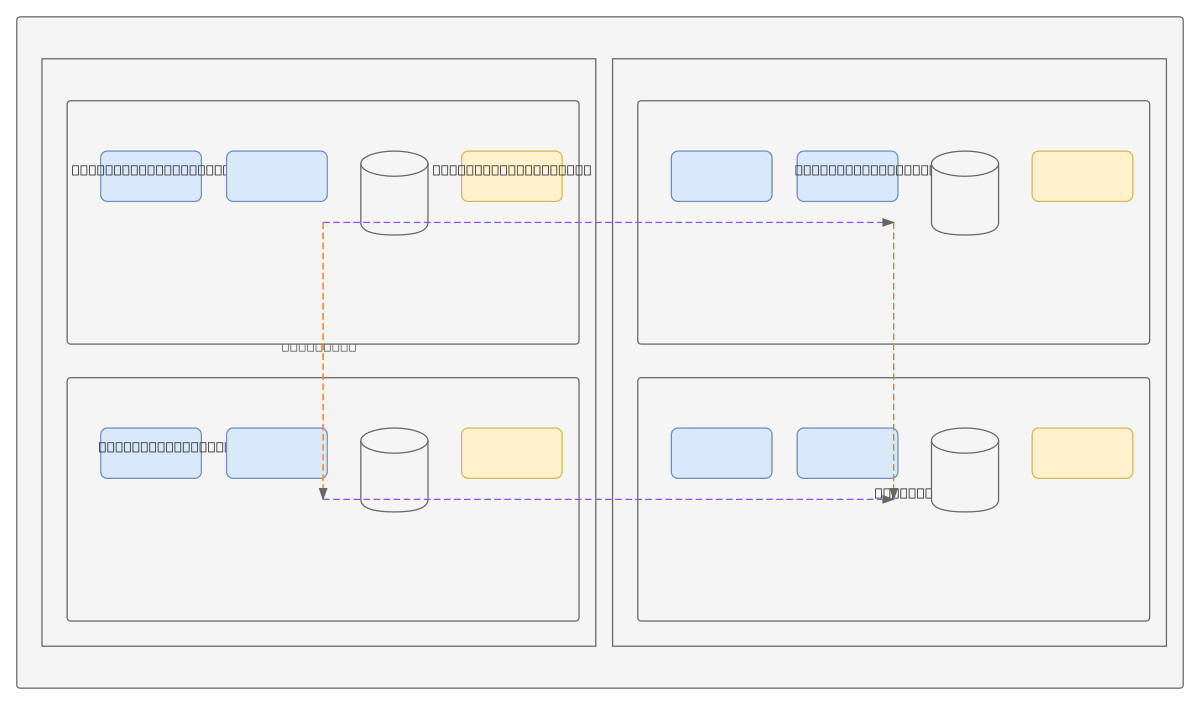
MTND Hypervisor HA Cluster architecture diagram

About This Architecture

MTND Hypervisor HA Cluster organizes four physical hypervisors into two redundant HA pairs, each running identical web, app, database, and monitoring VMs for fault tolerance. MTNDHYPER01 and MTNDHYPER02 form HA Pair 1 with cross-pair connections to HA Pair 2 (MTNDHYPER03 and MTNDHYPER04), creating a mesh topology that enables failover and load distribution. This architecture eliminates single points of failure by replicating the full application stack across independent hypervisors, ensuring service continuity during hardware or hypervisor failures. Fork and customize this diagram on Diagrams.so to match your hypervisor platform—VMware, Hyper-V, KVM, or Proxmox—and adjust VM resource allocation or monitoring strategies. The mesh interconnect between pairs supports both active-active and active-passive failover modes depending on your RTO and RPO requirements.

People also ask

How do I design a high-availability hypervisor cluster with redundant failover and replicated VMs?

The MTND Hypervisor HA Cluster uses four hypervisors (MTNDHYPER01–04) organized into two HA pairs with mesh interconnects, each running identical web, app, database, and monitoring VMs. This topology eliminates single points of failure and supports both active-active and active-passive failover modes, ensuring service continuity during hypervisor or hardware failures.

MTND Hypervisor HA Cluster

Autointermediatehypervisorhigh-availabilityfailoverclustervm-replicationinfrastructure-architecture
Domain: Cloud MultiAudience: infrastructure architects designing hypervisor-based high-availability clusters
9 views0 favoritesPublic

Created by

April 17, 2026

Updated

July 25, 2026 at 11:41 AM

Type

architecture

Need a custom architecture diagram?

Describe your architecture in plain English and get a production-ready Draw.io diagram in seconds. Works for AWS, Azure, GCP, Kubernetes, and more.

Generate with AI

AI-generated. Verify before production use. Learn more

Report this diagram