Monitoring & Observability Stack
GENERALArchitecture
About This Architecture
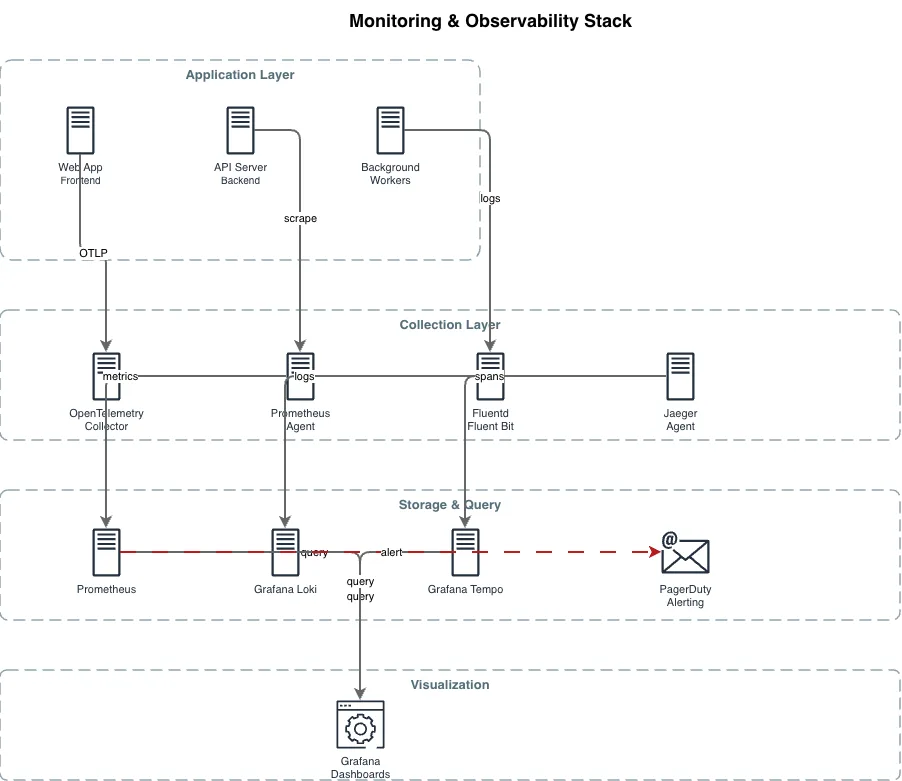
Full observability stack with OpenTelemetry Collector, Prometheus for metrics, Grafana Loki for logs, Grafana Tempo for traces, Fluentd for log shipping, and Grafana dashboards for visualization. Includes PagerDuty alerting integration.
Architecture prompt
Full observability stack with OpenTelemetry Collector, Prometheus for metrics, Grafana Loki for logs, Grafana Tempo for traces, Fluentd for log shipping, and Grafana dashboards for visualization. Includes PagerDuty alerting integration.
Generated by Diagrams.so — AI architecture diagram generator with native Draw.io output. Fork this diagram, remix it, or download as .drawio, PNG, or SVG.