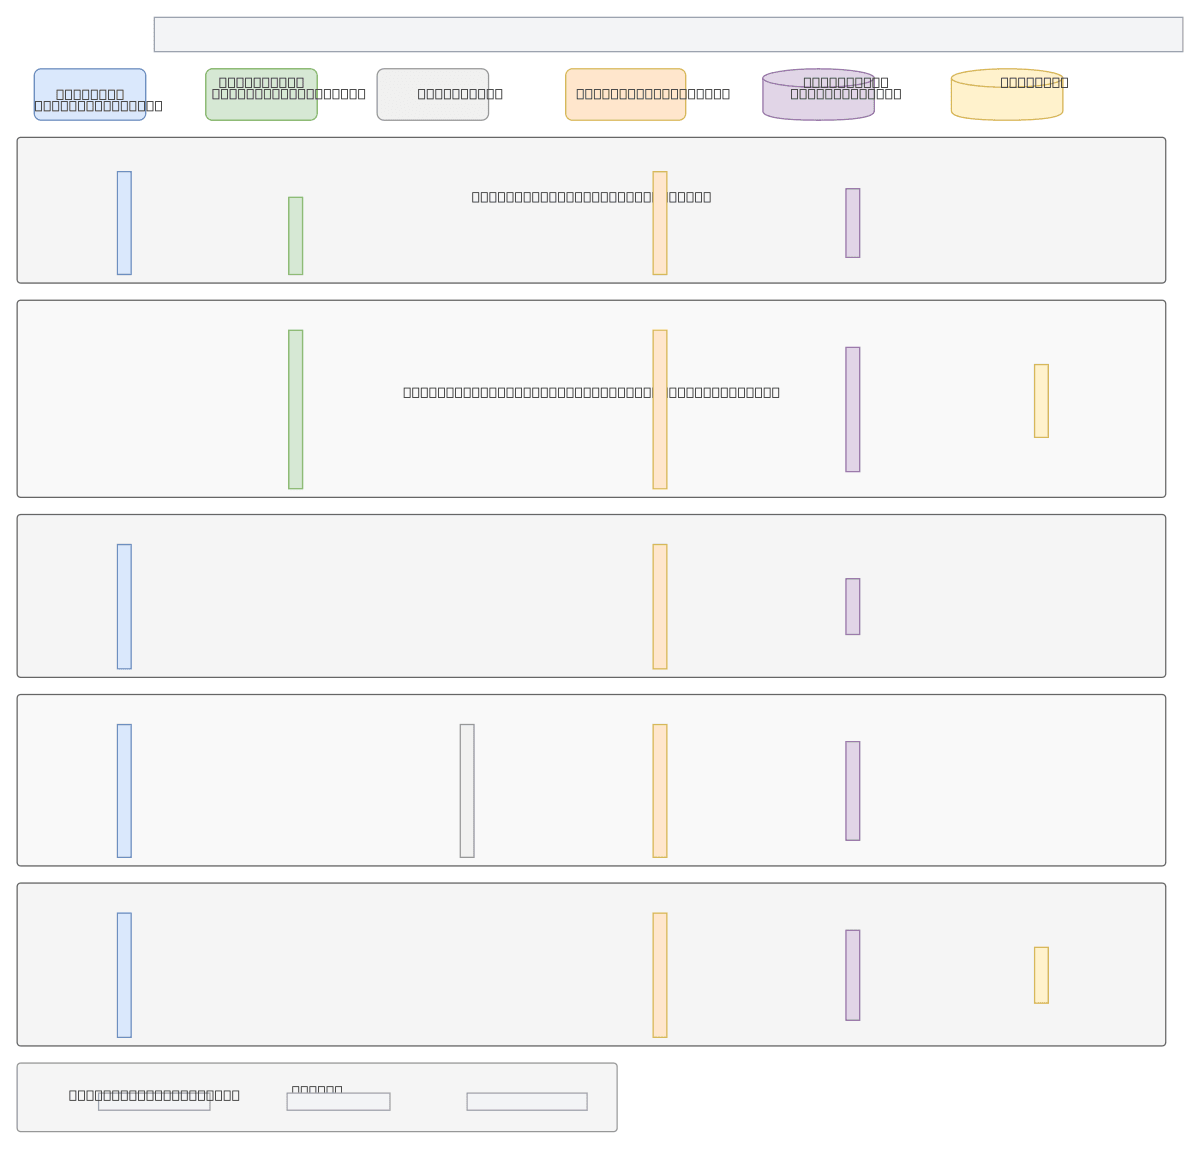
MIRA IT Asset Management - Sequence Diagram — MULTI architecture diagram

About This Architecture

MIRA IT Asset Management is a multi-phase sequence diagram orchestrating authentication, issue reporting, real-time notifications, asset management, and QR code workflows across Next.js web, Flutter mobile, Go API, PostgreSQL, and Supabase Storage. IT admins authenticate via Vercel-hosted web interface while staff users report issues from mobile, triggering backend API calls to PostgreSQL and asynchronous storage operations. Real-time Server-Sent Events (SSE) push notifications to admins, enabling instant visibility into asset issues and resolution workflows. The diagram demonstrates REST API synchronization, async responses, and SSE push patterns essential for responsive, multi-user IT operations platforms. Fork and customize this sequence diagram on Diagrams.so to adapt authentication flows, notification strategies, or asset tracking logic for your organization.

People also ask

How do you design a sequence diagram for a multi-platform IT asset management system with real-time notifications?

MIRA's sequence diagram shows five integrated phases: IT admins authenticate via Next.js on Vercel, staff users report issues from Flutter mobile, the Go Gorilla Mux API orchestrates PostgreSQL queries and Supabase Storage uploads, and Server-Sent Events push real-time notifications to admins for instant issue visibility and resolution workflows.

MIRA IT Asset Management - Sequence Diagram

Multiadvancedsequence-diagrammulti-cloudNext.jsFlutterGoPostgreSQL
Domain: Cloud MultiAudience: full-stack engineers building multi-platform IT asset management systems with Next.js, Flutter, and Go backends
7 views0 favoritesPublic

Created by

April 21, 2026

Updated

August 19, 2026 at 6:19 AM

Type

sequence

Need a custom architecture diagram?

Describe your architecture in plain English and get a production-ready Draw.io diagram in seconds. Works for AWS, Azure, GCP, Kubernetes, and more.

Generate with AI

AI-generated. Verify before production use. Learn more

Report this diagram