Diagrama de infrestructura
About This Architecture
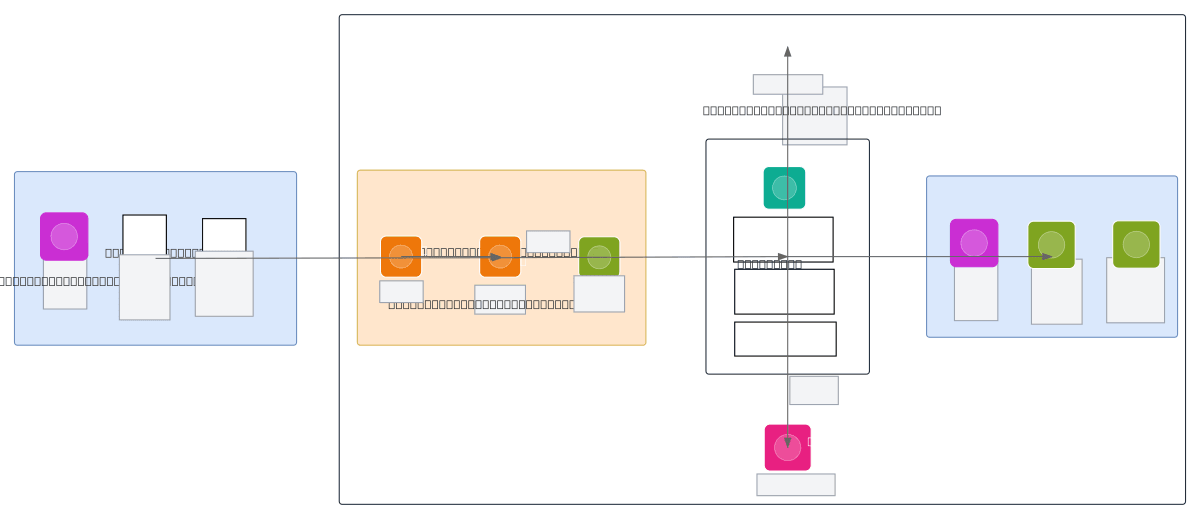
AI-powered retail price intelligence pipeline ingesting e-commerce and retail APIs from major Latin American chains (Tottus, Wong, Metro, Plaza Vea, Vivanda) into a unified data extraction and transformation layer. External data sources flow through extraction and transformation processes into Agentecore Runtime, which invokes Claude Haiku LLM with specialized tools for competitive price comparison, category listing, and data enrichment. The runtime orchestrates three core tools—comparar_precios_competencia, listar_categorias_universo, and additional processors—while Agentecore observability captures agent traces for performance monitoring and homologation metrics. Processed output feeds downstream distribution systems (Laive Distribuidoras) with homologated pricing data and performance KPIs stored in SQL Server backend. Fork this diagram on Diagrams.so to customize API sources, add new LLM tools, or integrate additional observability dashboards for your retail analytics stack.
People also ask
How do you build a scalable retail price intelligence system that extracts and compares competitor prices from multiple e-commerce chains using AI?
This diagram shows a production architecture combining external e-commerce APIs (Tottus, Wong, Metro, Plaza Vea, Vivanda) with extraction and transformation layers feeding into Agentecore Runtime. The runtime invokes Claude Haiku LLM with specialized tools for price comparison and category listing, while observability traces monitor agent performance and data homologation metrics before output rea
- Domain:
- Data Engineering
- Audience:
- Data engineers building retail price intelligence pipelines with AI-driven data extraction
Generated by Diagrams.so — AI architecture diagram generator with native Draw.io output. Fork this diagram, remix it, or download as .drawio, PNG, or SVG.