Determinacion del Coeficiente de Permeabilidad K — AWS architecture diagram

About This Architecture

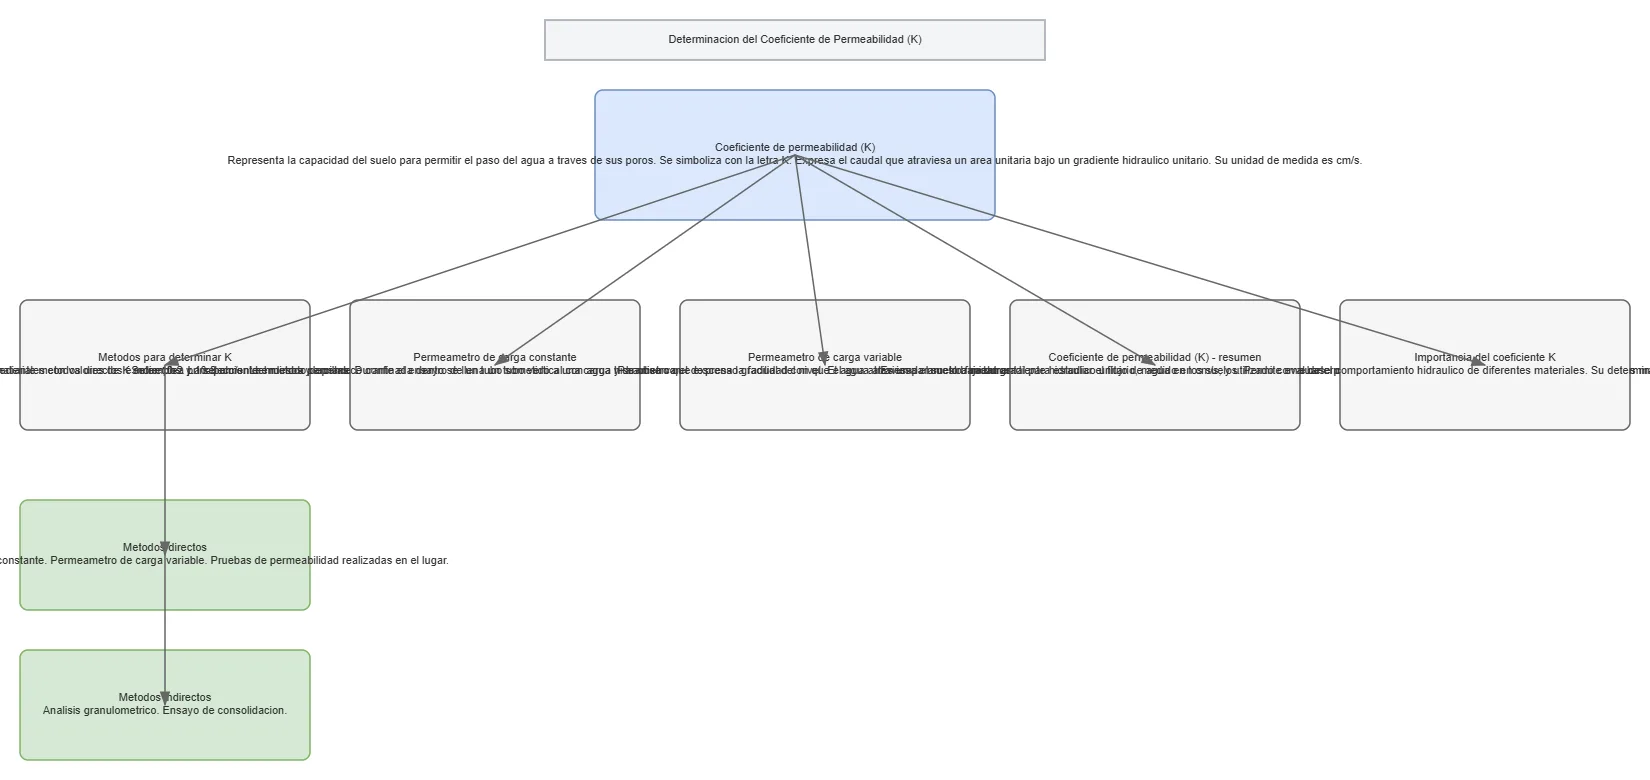
Soil permeability coefficient (K) determination flowchart maps methods for measuring soil's capacity to allow fluid flow through its pores. The diagram branches into direct methods using constant-head and variable-head permeameters suited for different soil types, and indirect methods via grain-size analysis and consolidation testing. Understanding K is critical for designing foundations, drainage systems, and assessing groundwater movement in civil engineering projects. Fork this diagram on Diagrams.so to customize soil classification categories, add site-specific parameters, or integrate with your geotechnical reporting workflow.

People also ask

What are the direct and indirect methods for determining soil permeability coefficient K in geotechnical engineering?

Soil permeability coefficient K can be determined via direct methods (constant-head permeameter for highly permeable soils, variable-head permeameter for silts and clays) or indirect methods (grain-size analysis and consolidation testing). This diagram organizes these approaches to help engineers select the appropriate testing method based on soil type and project requirements.

Determinacion del Coeficiente de Permeabilidad K

AWSintermediategeotechnical engineeringsoil permeabilityhydraulic conductivitylaboratory testingcivil engineering
Domain: OtherAudience: Civil engineers and geotechnical professionals determining soil permeability coefficients
2 views0 favoritesPublic

Created by

July 18, 2026

Updated

August 2, 2026 at 1:11 PM

Type

flowchart

Need a custom architecture diagram?

Describe your architecture in plain English and get a production-ready Draw.io diagram in seconds. Works for AWS, Azure, GCP, Kubernetes, and more.

Generate with AI

AI-generated. Verify before production use. Learn more

Report this diagram