Kubernetes Observability Stack - Monitoring, Logging & Tracing
About This Architecture
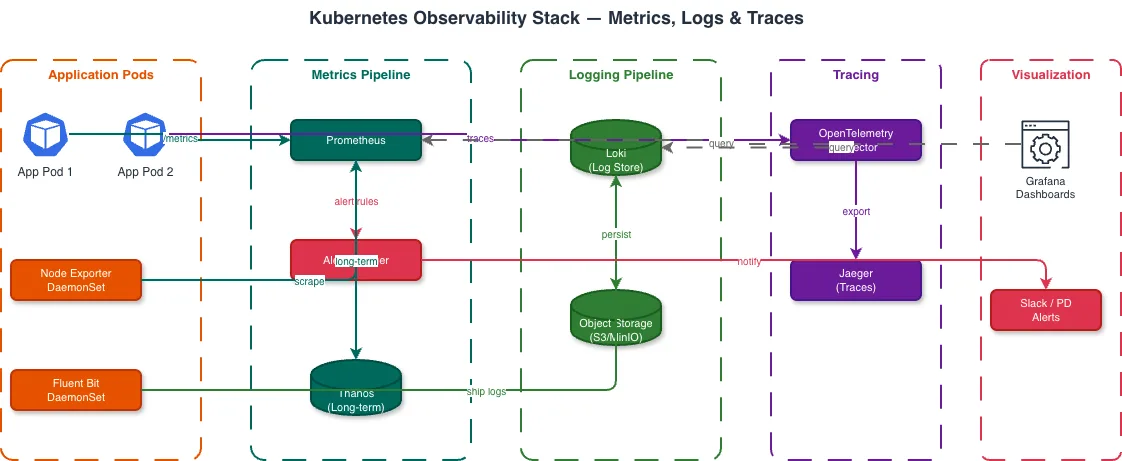
Full observability stack for Kubernetes clusters featuring Prometheus for metrics collection, Grafana for dashboards, Loki for log aggregation, Jaeger for distributed tracing, and Alertmanager for incident notifications. Shows how DaemonSets collect node-level data and sidecars instrument application pods. Fork this diagram on Diagrams.so to customize the observability tools (Datadog, New Relic) or add OpenTelemetry collectors for your monitoring strategy. Source: https://devtron.ai/blog/kubernetes-architecture-the-ultimate-guide/
Architecture prompt
Full observability stack for Kubernetes clusters featuring Prometheus for metrics collection, Grafana for dashboards, Loki for log aggregation, Jaeger for distributed tracing, and Alertmanager for incident notifications. Shows how DaemonSets collect node-level data and sidecars instrument application pods. Fork this diagram on Diagrams.so to customize the observability tools (Datadog, New Relic) or add OpenTelemetry collectors for your monitoring strategy. Source: https://devtron.ai/blog/kuber...
Generated by Diagrams.so — AI architecture diagram generator with native Draw.io output. Fork this diagram, remix it, or download as .drawio, PNG, or SVG.