Kubernetes Observability Stack with Monitoring and Logging
About This Architecture
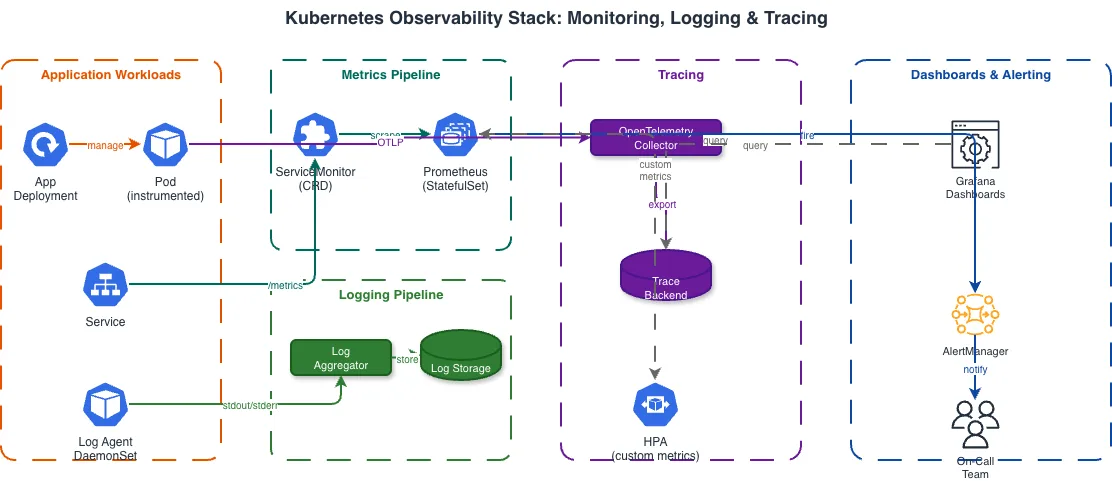
Full Kubernetes observability stack with Prometheus metrics collection, log aggregation, distributed tracing, and alerting. Features DaemonSets for node-level collection, ServiceMonitor CRDs, and centralized dashboards for cluster-wide visibility. Fork this diagram on Diagrams.so to customize the metrics pipeline or add custom exporters for your observability requirements. Source: https://kubernetes.io/blog/
Architecture prompt
Full Kubernetes observability stack with Prometheus metrics collection, log aggregation, distributed tracing, and alerting. Features DaemonSets for node-level collection, ServiceMonitor CRDs, and centralized dashboards for cluster-wide visibility. Fork this diagram on Diagrams.so to customize the metrics pipeline or add custom exporters for your observability requirements. Source: https://kubernetes.io/blog/
Generated by Diagrams.so — AI architecture diagram generator with native Draw.io output. Fork this diagram, remix it, or download as .drawio, PNG, or SVG.