Kubernetes Observability Stack - Metrics, Logs & Traces
About This Architecture
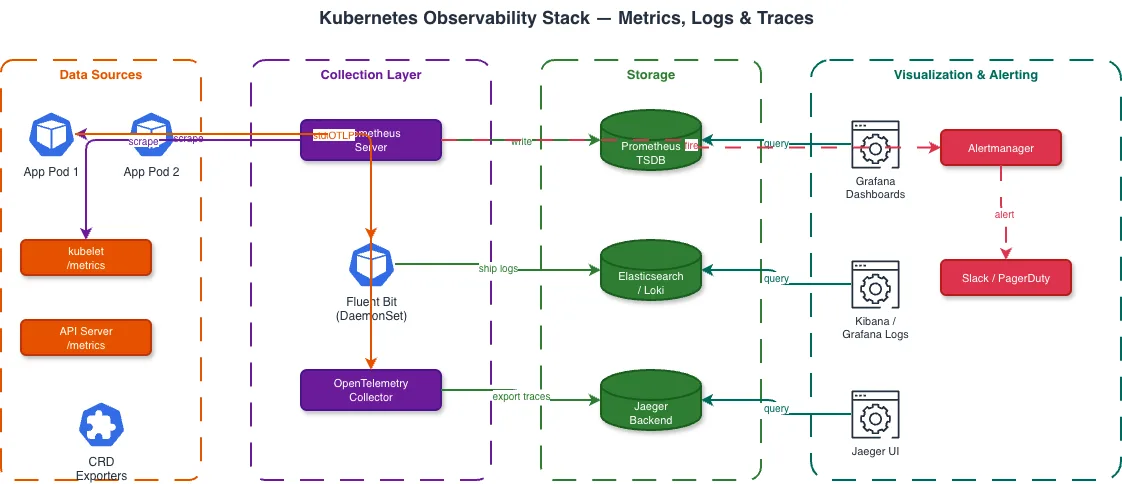
Complete Kubernetes observability architecture with Prometheus for metrics collection, Grafana for visualization, Fluentd/Fluent Bit for log aggregation, Jaeger for distributed tracing, and Alertmanager for incident notification. Shows data flow from pods through collection agents to dashboards. Fork this diagram on Diagrams.so to customize the log backend or add custom metrics exporters for your monitoring stack. Source: https://kubernetes.io/docs/concepts/architecture/
Architecture prompt
Complete Kubernetes observability architecture with Prometheus for metrics collection, Grafana for visualization, Fluentd/Fluent Bit for log aggregation, Jaeger for distributed tracing, and Alertmanager for incident notification. Shows data flow from pods through collection agents to dashboards. Fork this diagram on Diagrams.so to customize the log backend or add custom metrics exporters for your monitoring stack. Source: https://kubernetes.io/docs/concepts/architecture/
Generated by Diagrams.so — AI architecture diagram generator with native Draw.io output. Fork this diagram, remix it, or download as .drawio, PNG, or SVG.