Kubernetes Cloud Native Monitoring Stack
About This Architecture
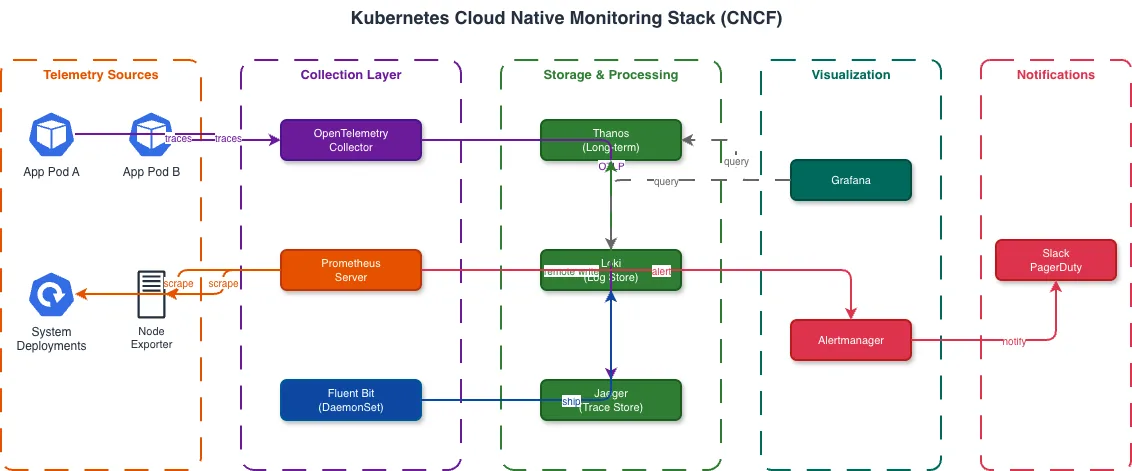
Complete CNCF-aligned monitoring stack on Kubernetes with Prometheus for metrics collection, Alertmanager for alerting, Grafana for visualization, Loki for log aggregation, Jaeger for distributed tracing, and OpenTelemetry collectors for unified telemetry. Fork this diagram on Diagrams.so to customize the alerting rules or add custom exporters for your monitoring pipeline. Source: https://landscape.cncf.io/
Architecture prompt
Complete CNCF-aligned monitoring stack on Kubernetes with Prometheus for metrics collection, Alertmanager for alerting, Grafana for visualization, Loki for log aggregation, Jaeger for distributed tracing, and OpenTelemetry collectors for unified telemetry. Fork this diagram on Diagrams.so to customize the alerting rules or add custom exporters for your monitoring pipeline. Source: https://landscape.cncf.io/
Generated by Diagrams.so — AI architecture diagram generator with native Draw.io output. Fork this diagram, remix it, or download as .drawio, PNG, or SVG.