36-Month Research Work Plan and Timeline
About This Architecture
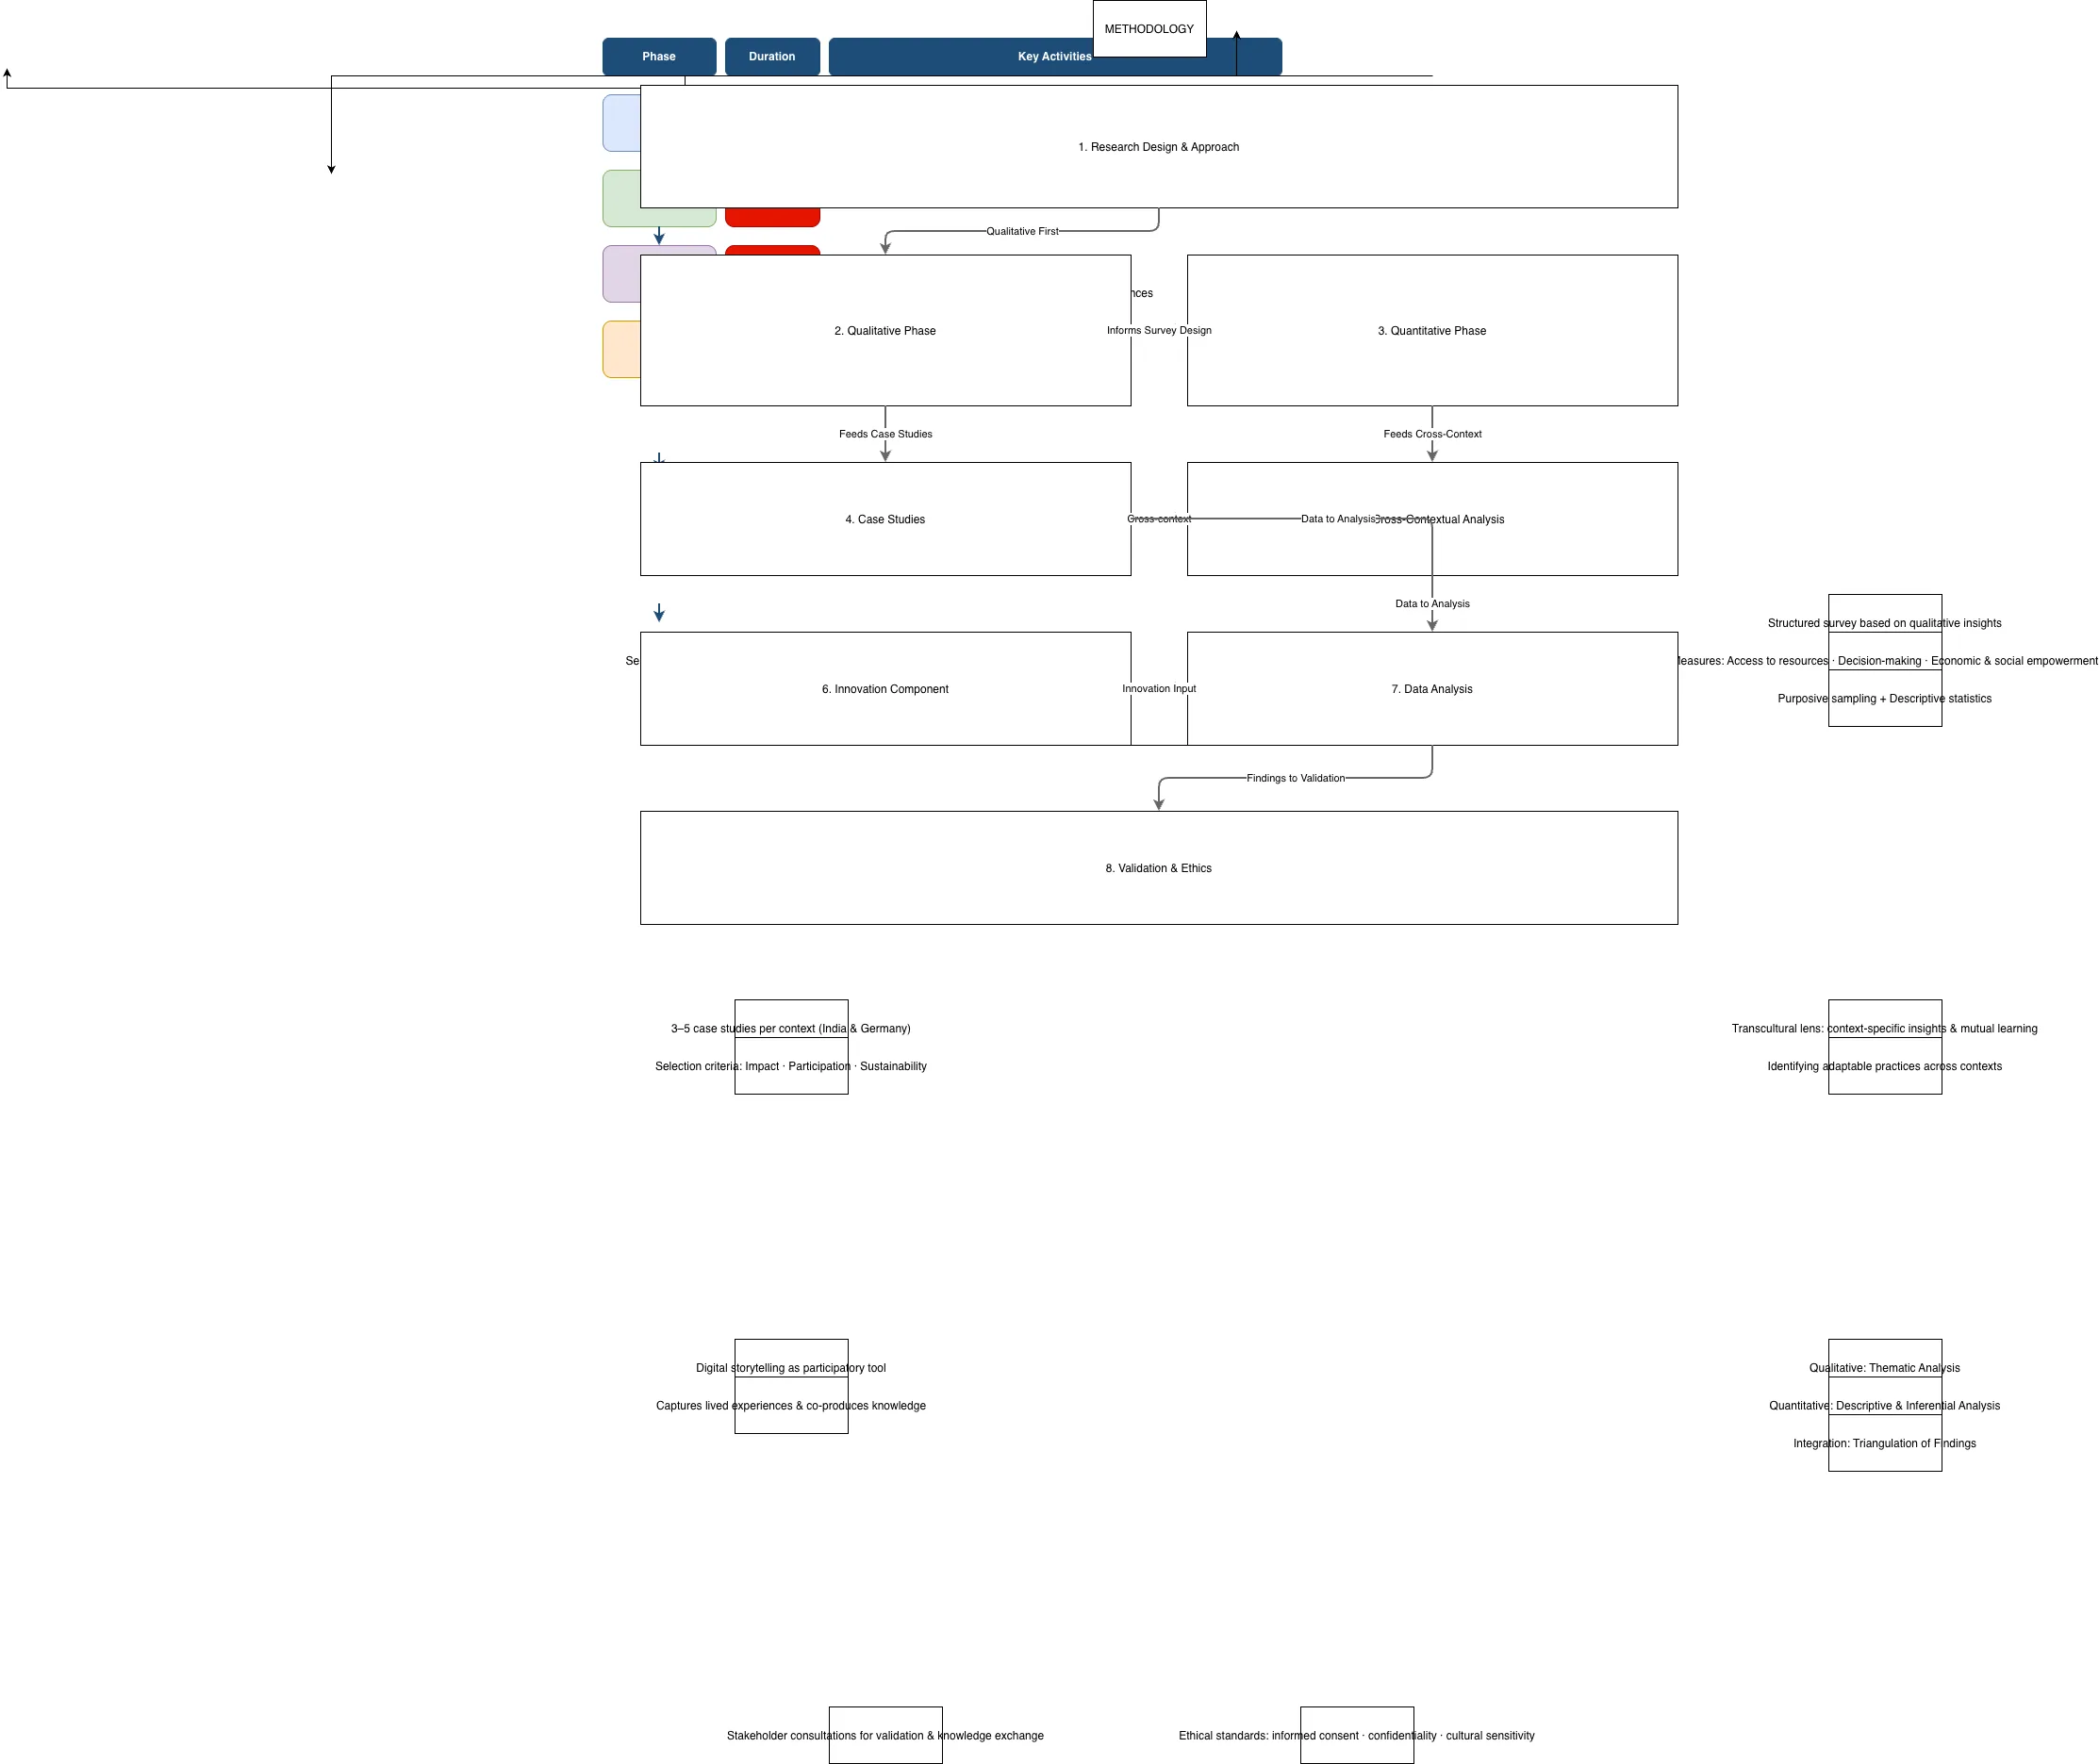
A comprehensive 36-month research timeline spanning eight sequential phases from literature review through dissemination, integrating qualitative fieldwork in India and Germany with large-scale quantitative data collection. The plan progresses from ethics approval and co-design workshops through fieldwork, survey development, data analysis, framework validation, and culminates in peer-reviewed publications and policy briefs. This structured approach demonstrates best practices for managing complex, multi-site, mixed-methods research with clear milestones and deliverables at each stage. Fork this diagram on Diagrams.so to customize phases, adjust timelines, or adapt the template for your own longitudinal research project. The sequential dependency model ensures stakeholder alignment and enables early identification of critical path delays.
People also ask
How should I structure a 36-month mixed-methods research project with fieldwork in multiple countries?
This diagram outlines an eight-phase research timeline: Phase 1 establishes ethics approval and co-design workshops (M1–M3); Phases 2–3 conduct qualitative fieldwork in India and Germany (M4–M12); Phase 4 designs and pilots survey instruments (M13–M15); Phase 5 collects large-scale quantitative data (M16–M20); Phase 6 integrates findings through mixed-methods analysis (M21–M24); Phase 7 validates
- Domain:
- Other
- Audience:
- research project managers and academic researchers planning multi-year mixed-methods studies
Generated by Diagrams.so — AI architecture diagram generator with native Draw.io output. Fork this diagram, remix it, or download as .drawio, PNG, or SVG.