Water Quality Monitoring System Flowchart
About This Architecture
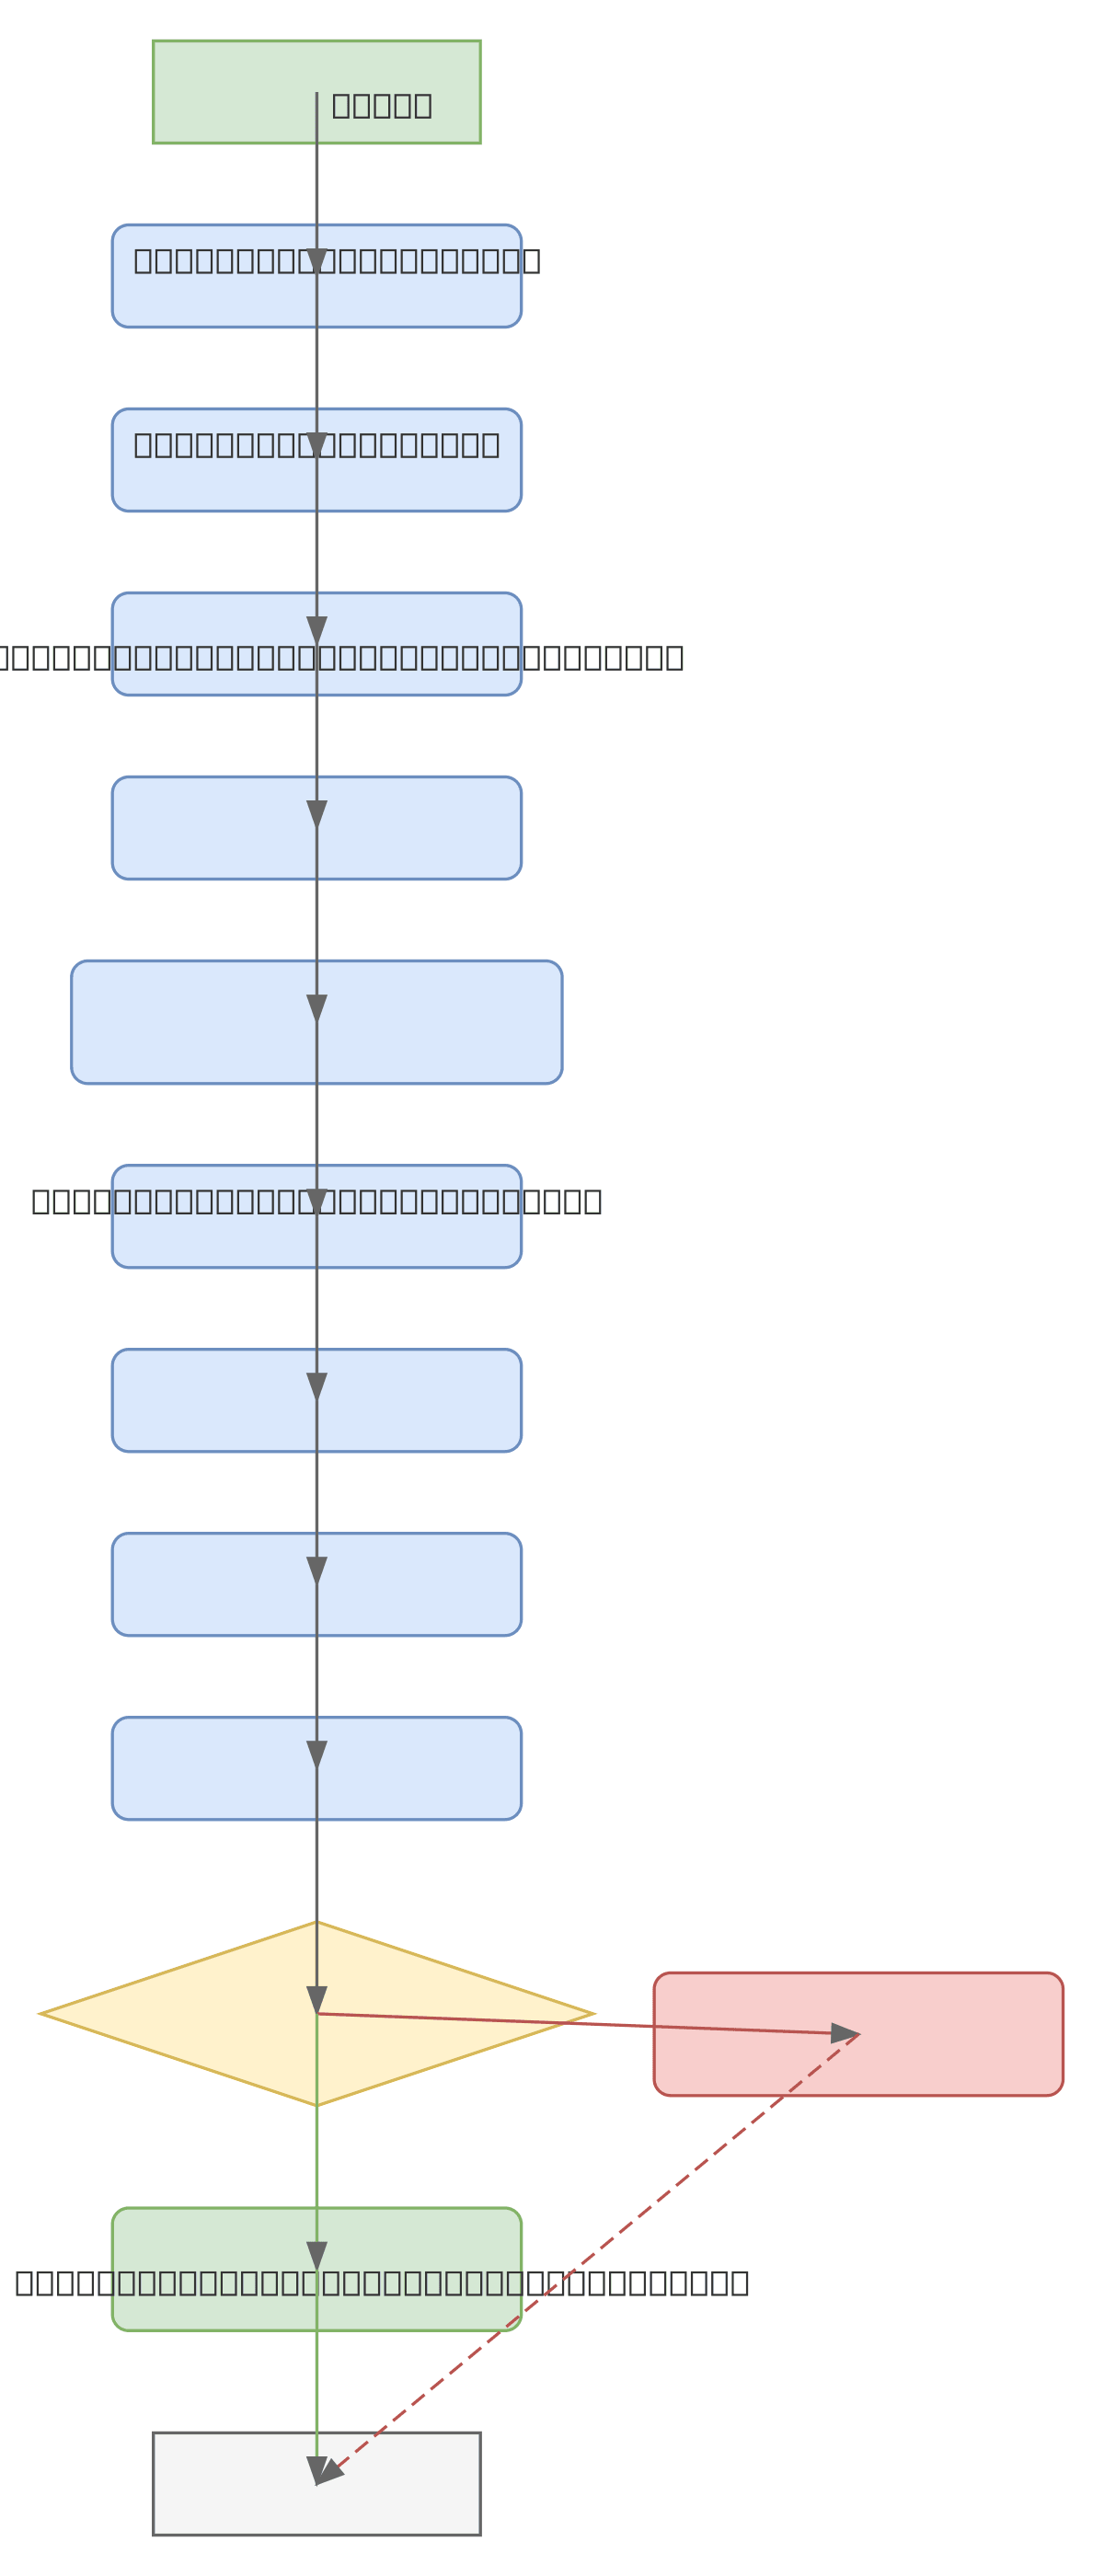
Water quality monitoring system combining fluorescence spectroscopy with AI/ML for real-time contaminant detection. The workflow begins with sample collection and MUG reagent addition, followed by dual light excitation (UV and blue wavelengths) to trigger fluorescence detection. Sensor data collection captures lead, fluoride, pH, turbidity, and temperature measurements, which flow through signal processing, ADC conversion, feature extraction, and data preprocessing before reaching an AI/ML model for contaminant prediction. The system compares predicted contaminant levels against safe limits and triggers alerts or displays safe status accordingly. This architecture demonstrates how spectroscopic analysis combined with machine learning enables rapid, automated water quality assessment. Fork and customize this flowchart on Diagrams.so to adapt sensor types, add additional contaminants, or integrate with SCADA or IoT platforms.
People also ask
How does a water quality monitoring system use fluorescence spectroscopy and machine learning to detect contaminants in real time?
This diagram shows a complete workflow where water samples are treated with MUG reagent and exposed to dual light excitation (UV and blue), generating fluorescence signals detected by sensors. The system collects multi-parameter data (lead, fluoride, pH, turbidity, temperature), processes signals through ADC conversion, extracts features, and feeds preprocessed data into an AI/ML model that predic
- Domain:
- Other
- Audience:
- Environmental engineers and water quality monitoring specialists
Generated by Diagrams.so — AI architecture diagram generator with native Draw.io output. Fork this diagram, remix it, or download as .drawio, PNG, or SVG.