University System ER Diagram
About This Architecture
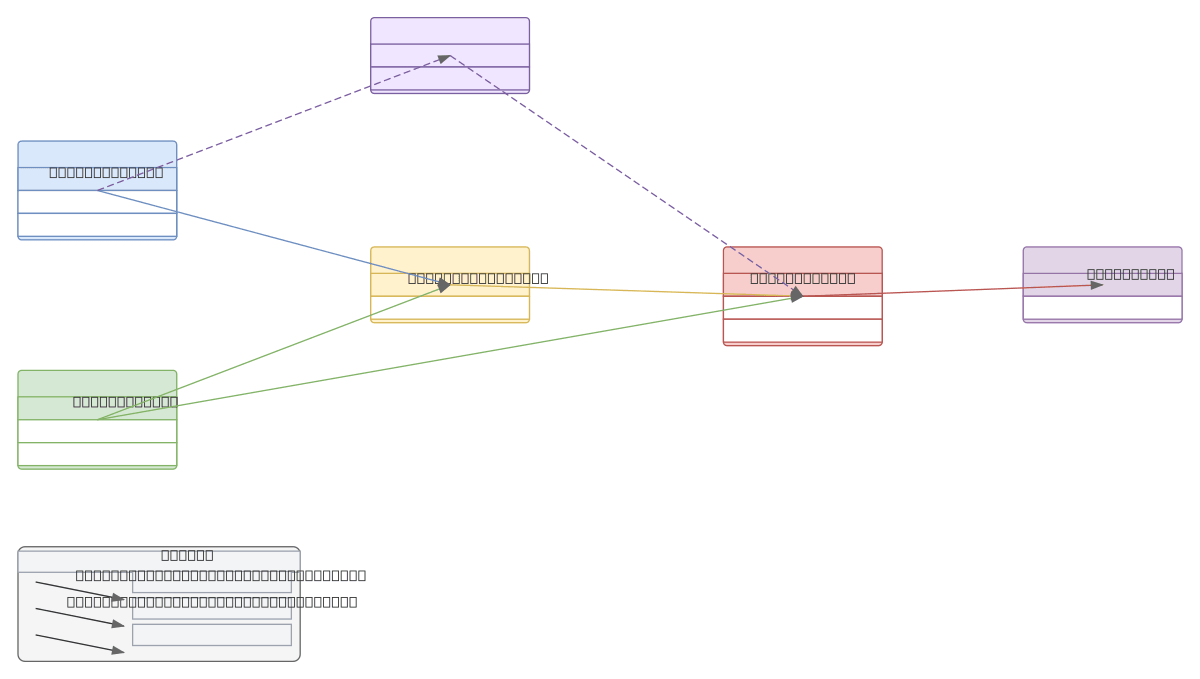
University System ER diagram models the core entities and relationships in an academic institution: Students, Doctors (faculty), Departments, Courses, Rooms, and Enrollments. Data flows from Students and Doctors through Departments to Courses, with Enrollments capturing the many-to-many relationship between Students and Courses, and Rooms assigned to Courses. This normalized schema demonstrates best practices for managing student records, faculty assignments, course catalogs, and classroom allocation while maintaining referential integrity. Fork and customize this diagram on Diagrams.so to adapt it for your institution's specific requirements, add additional entities like Prerequisites or Grades, or export as .drawio or PNG for documentation. The legend clearly distinguishes total participation (mandatory) from partial participation (optional) relationships, making it ideal for database design reviews and academic system planning.
People also ask
How do I design a database schema for a university system that manages students, faculty, courses, and enrollments?
This ER diagram provides a normalized schema with Student, Doctor (faculty), Department, Course, Room, and Enrollment entities. Students and Doctors belong to Departments; Departments offer Courses held in Rooms; Students enroll in Courses through the Enrollment junction table. The diagram uses participation constraints to show which relationships are mandatory versus optional.
- Domain:
- Software Architecture
- Audience:
- database designers and data modelers building academic management systems
Generated by Diagrams.so — AI architecture diagram generator with native Draw.io output. Fork this diagram, remix it, or download as .drawio, PNG, or SVG.