Plasticidad de los Suelos - Mecanica de Suelos
About This Architecture
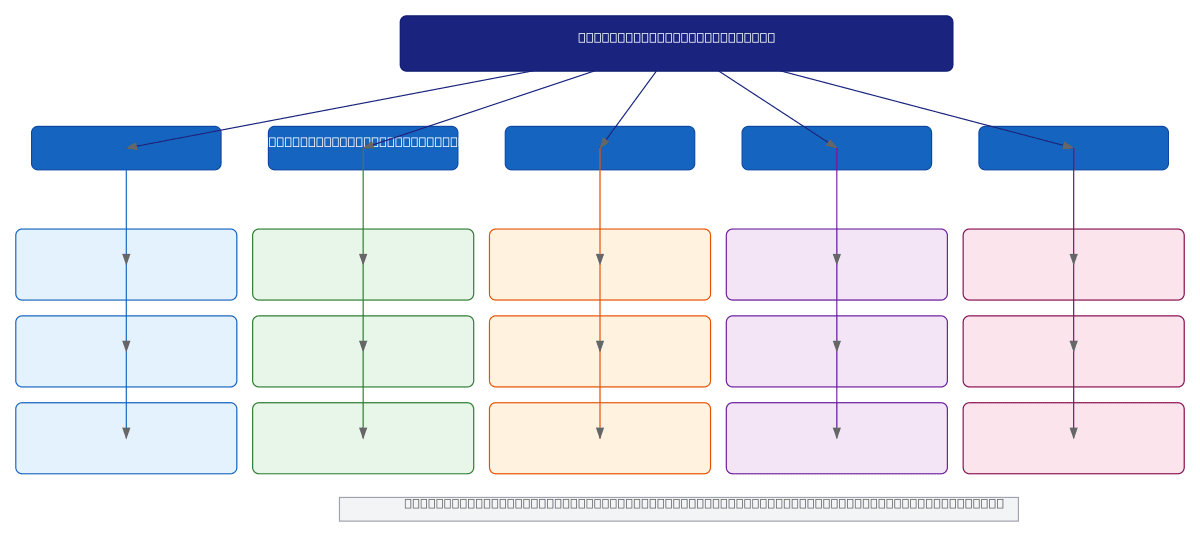
Soil plasticity fundamentals covering the deformation behavior of clay-rich soils without cracking or volume loss, governed by water content and clay mineral structure. The diagram maps four soil consistency states—solid, semi-solid, plastic, and liquid—and their transitions via Atterberg limits (LL, LP, LC) determined by ASTM D4318 laboratory testing. Plasticity Index (IP = LL − LP) and Liquidity Index (IL) quantify soil compressibility and current consistency, enabling engineers to predict settlement, liquefaction risk, and construction suitability. Fork this flowchart to customize for regional soil classifications, add site-specific test data, or embed in geotechnical reports and course materials. The practical example (LL 68.40%, LP 22.71%, IP 45.69%) demonstrates high-plasticity clay behavior critical for foundation design.
People also ask
What are Atterberg limits and how do they determine soil plasticity and consistency?
Atterberg limits (Liquid Limit, Plastic Limit, Shrinkage Limit) are ASTM D4318 thresholds that define transitions between soil consistency states. Plasticity Index (IP = LL − LP) and Liquidity Index (IL) quantify soil deformability and current moisture state, enabling prediction of compressibility, settlement, and liquefaction risk in foundation design.
- Domain:
- Mechanical Engineering
- Audience:
- Civil and geotechnical engineers studying soil mechanics and plasticity classification
Generated by Diagrams.so — AI architecture diagram generator with native Draw.io output. Fork this diagram, remix it, or download as .drawio, PNG, or SVG.