PFE circulee Data Flow Diagram
About This Architecture
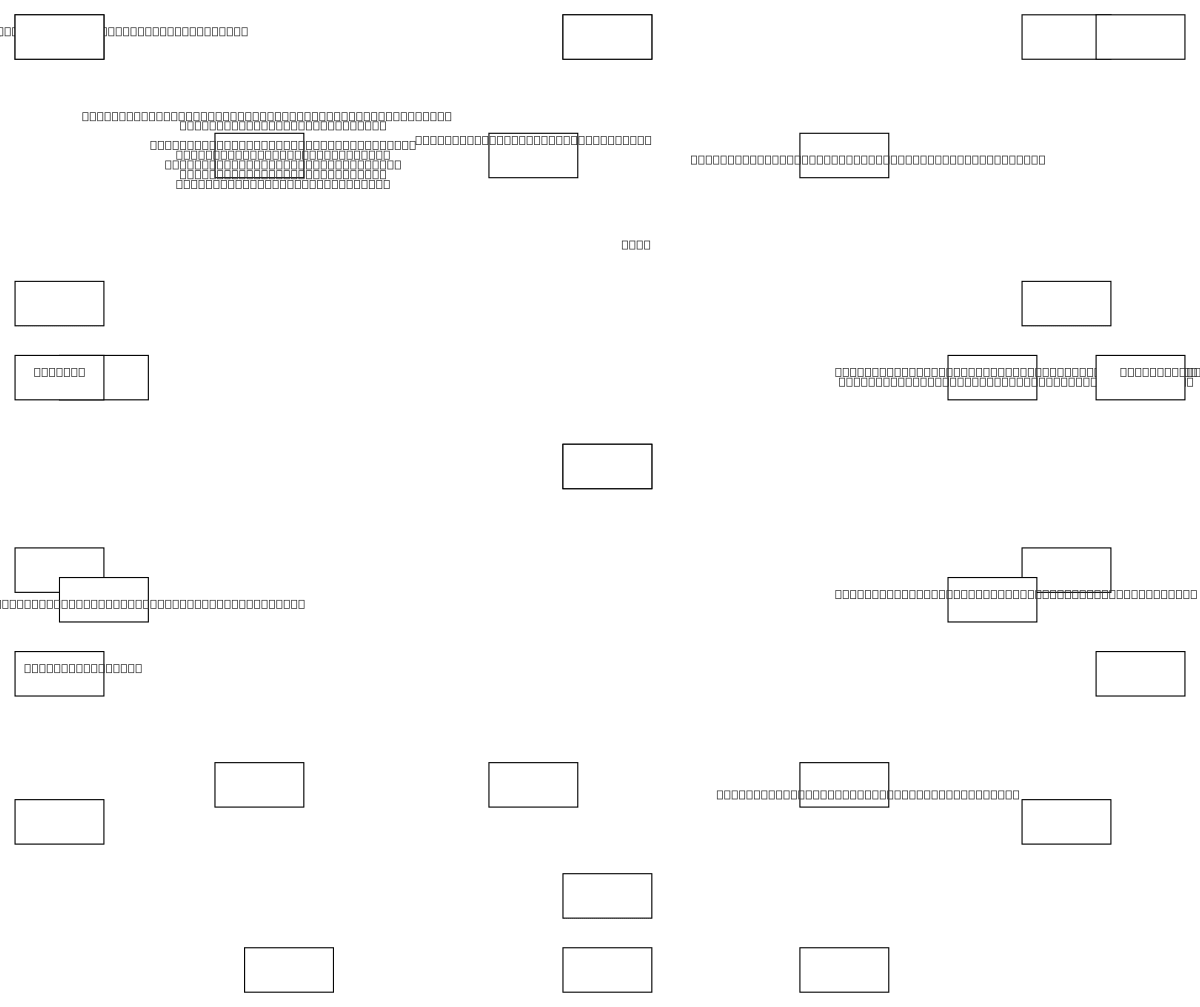
PFE Emetteurs Data Flow Diagram orchestrates toll transaction data from multiple sources—PFE_CIRCULEE, AUTRES_EMETTEURS, REFERENTIEL_GARJU, SI_PEAGE, and INCONNU—into a unified processing hub. Data flows through enrichment and validation stages (TRANS_ENRICHIES, TRANS_AVEC_REF_CRMENS) before distribution to SAP financial modules (SAP_FI, SAP_SD), billing systems (ADVU, PA_SERES), and partner networks (BIP&GO, EMOVIS_UK, PARTENAIRES). The architecture implements bidirectional acknowledgment flows (ACK_TRANSACTIONS, ACK_GARJU, ACK_COMPTABLE) ensuring data integrity across toll operators SANEF and SAPN. This pattern demonstrates enterprise data governance for high-volume transaction processing with multi-destination routing and compliance tracking. Fork and customize this diagram on Diagrams.so to adapt toll collection workflows, add new emitter sources, or integrate additional financial systems.
People also ask
How do toll collection systems route transaction data from multiple emitters through enrichment and validation to financial and billing systems?
The PFE Emetteurs diagram shows toll transactions flowing from sources like PFE_CIRCULEE and AUTRES_EMETTEURS through enrichment stages (TRANS_ENRICHIES) into SAP modules (SAP_FI, SAP_SD) and billing systems (ADVU, PA_SERES), with acknowledgment flows (ACK_TRANSACTIONS, ACK_COMPTABLE) confirming processing at each stage for SANEF and SAPN operators.
- Domain:
- Data Engineering
- Audience:
- Data engineers and enterprise architects designing toll collection and payment processing data flows
Generated by Diagrams.so — AI architecture diagram generator with native Draw.io output. Fork this diagram, remix it, or download as .drawio, PNG, or SVG.