Medical Image Segmentation System Flowchart
About This Architecture
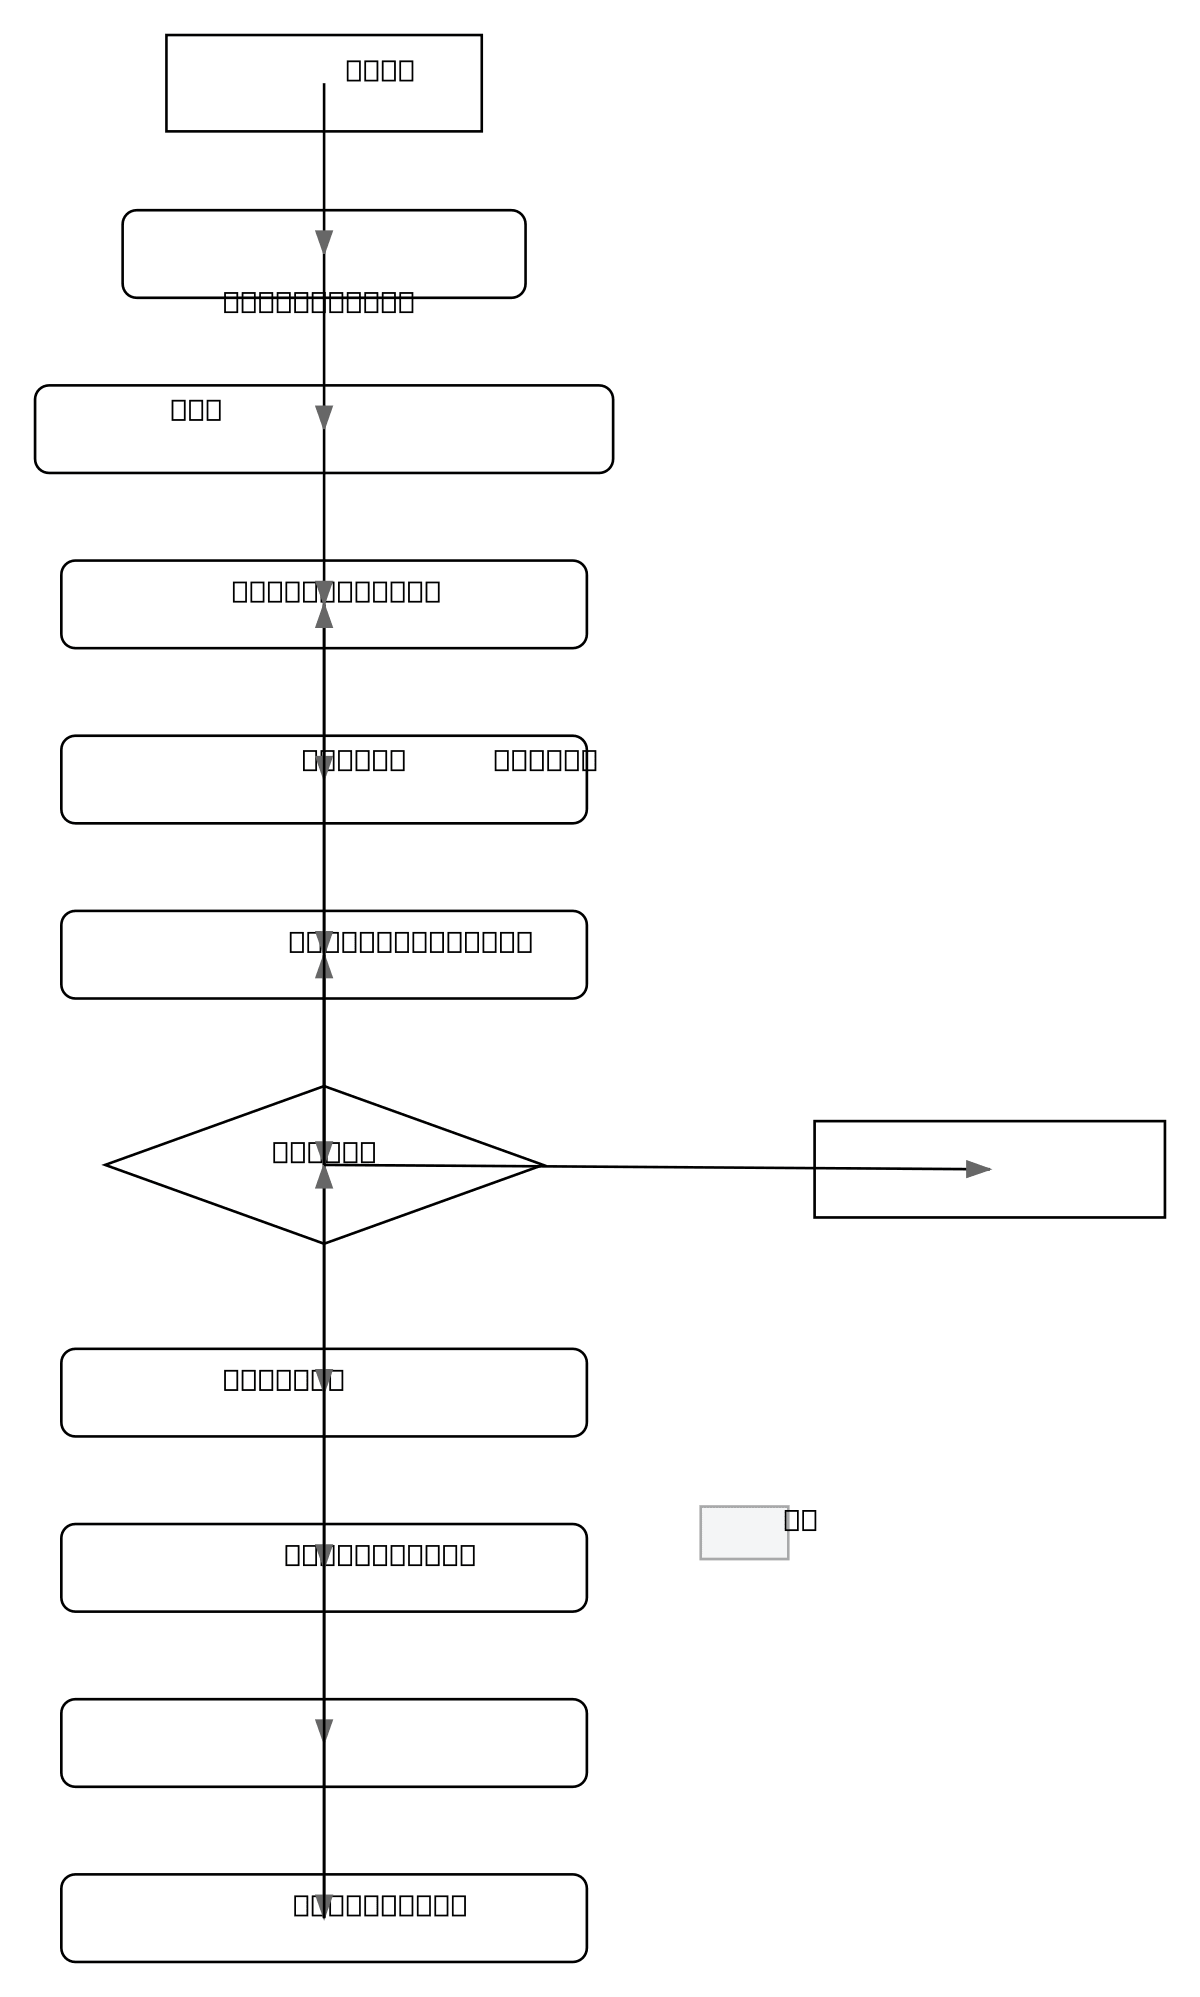
MSDCA-UNet medical image segmentation system orchestrates interactive 3D MRI analysis through a GUI-driven workflow. The pipeline loads multimodal NIfTI volumetric data, applies Z-score normalization preprocessing, executes model inference on GPU, and renders predicted segmentation masks in real-time. This architecture demonstrates best practices for clinical-grade deep learning applications: efficient memory management, interactive slice-by-slice navigation, and immediate visual feedback for radiologists. Fork this diagram on Diagrams.so to customize preprocessing steps, integrate alternative segmentation models, or adapt the rendering pipeline for your imaging modality. The feedback loop between user interaction and slice rendering enables iterative refinement workflows common in diagnostic imaging tools.
People also ask
How does a medical image segmentation system integrate deep learning model inference with interactive GUI rendering for 3D MRI analysis?
This flowchart shows a complete MSDCA-UNet pipeline: GUI initialization loads pretrained weights to GPU, then multimodal NIfTI volumetric data is read and rendered slice-by-slice. User interaction triggers Z-score normalization, tensor conversion, and model inference, producing probability maps thresholded into segmentation masks displayed in real-time. The feedback loop enables iterative refineme
- Domain:
- Ml Pipeline
- Audience:
- Medical imaging engineers and ML researchers implementing deep learning segmentation systems
Generated by Diagrams.so — AI architecture diagram generator with native Draw.io output. Fork this diagram, remix it, or download as .drawio, PNG, or SVG.