
About This Architecture
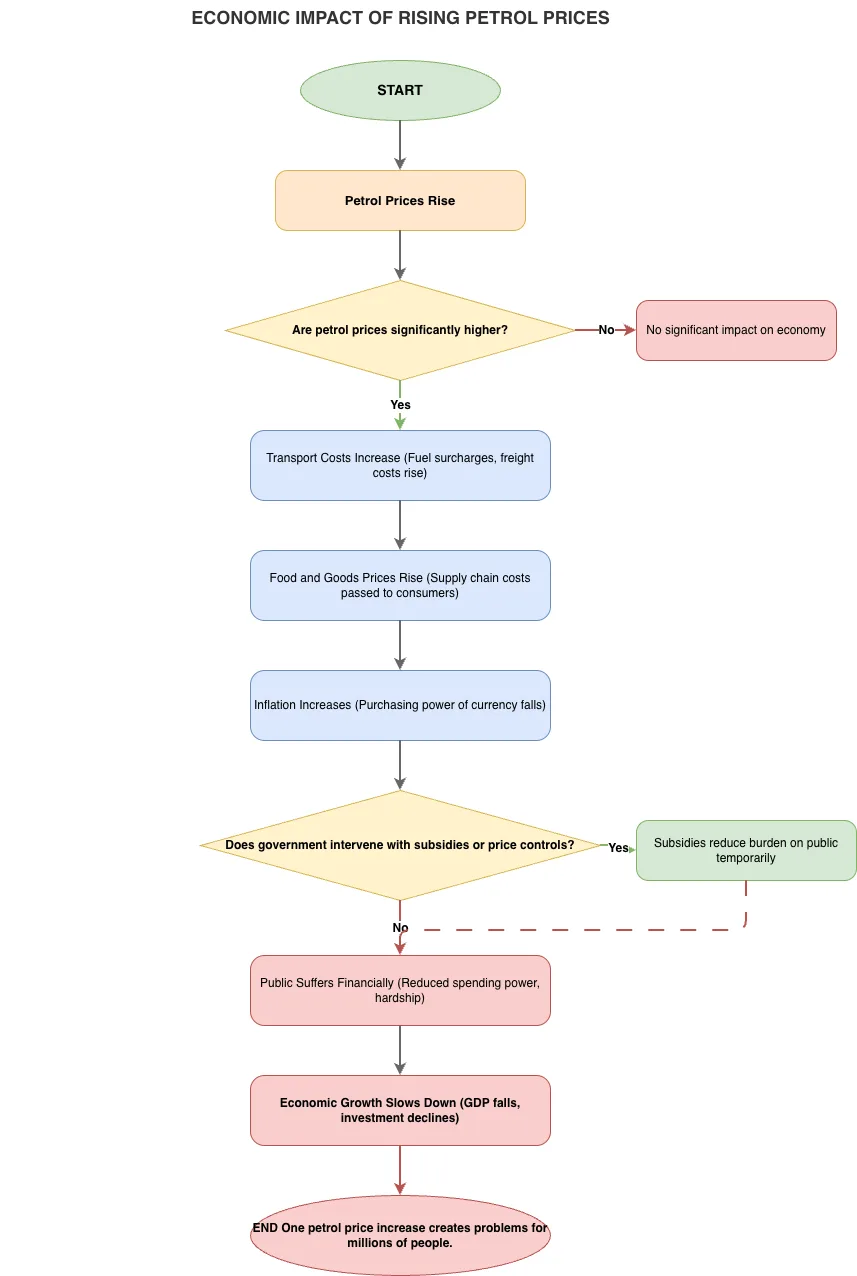
Economic impact flowchart tracing how rising petrol prices cascade through transport costs, supply chains, and inflation to reduce consumer purchasing power and slow GDP growth. The diagram maps decision points where government intervention via subsidies or price controls may temporarily ease public burden but ultimately leads to financial hardship and economic contraction. Each node represents a stage in the transmission mechanism from fuel cost shock to broad macroeconomic slowdown. Fork this flowchart to customize scenarios, add regional variations, or integrate with your economics curriculum and policy briefings. The model demonstrates how a single commodity price increase creates systemic problems affecting millions through interconnected economic channels.