Beam Search Test-Time Scaling Flowchart
About This Architecture
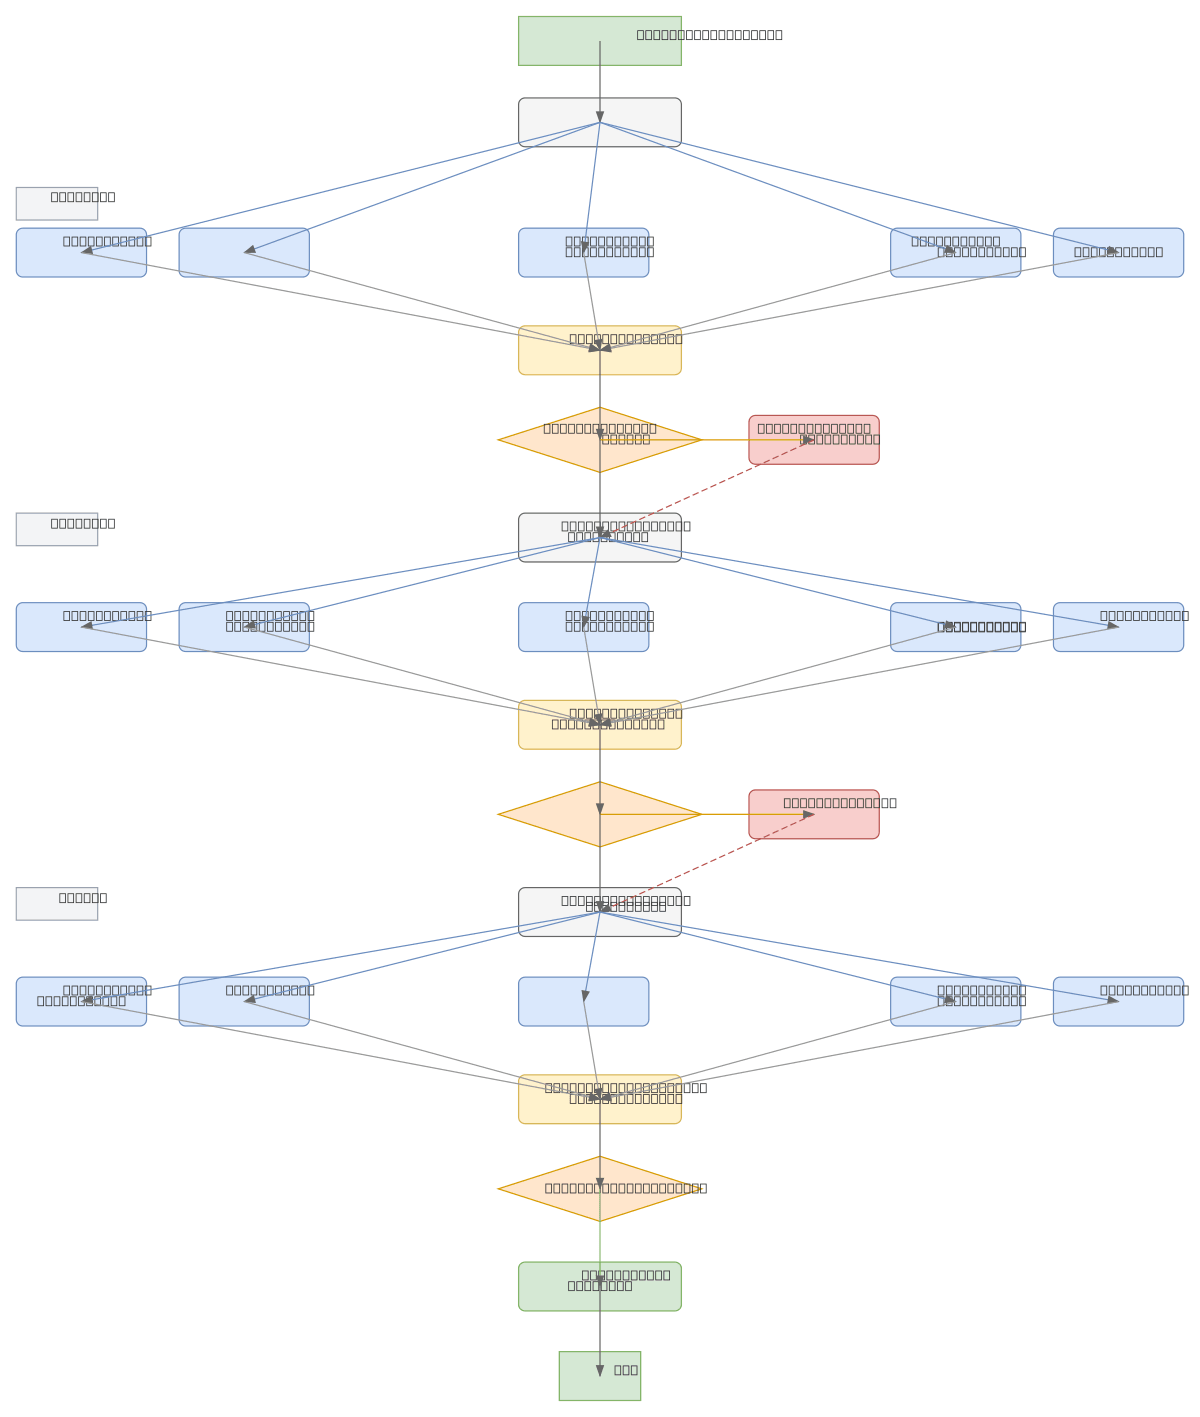
Beam search test-time scaling flowchart demonstrates iterative candidate expansion and pruning across multiple decoding steps. At each step, surviving beams are expanded to generate new candidates, scored, ranked, and pruned to maintain a fixed beam width of five. This architecture enables controlled exploration of the solution space during inference, balancing computational cost against output quality. Fork this diagram on Diagrams.so to customize beam width, scoring functions, or pruning thresholds for your language model or sequence generation task. The flowchart pattern applies to neural machine translation, text summarization, and any autoregressive decoding scenario.
People also ask
How does beam search work during inference, and how are candidates expanded and pruned at each step?
Beam search maintains a fixed number of top-scoring candidates (beam width) across decoding steps. At each step, surviving beams are expanded to generate new candidates, all candidates are scored and ranked, and low-scoring candidates are pruned to keep only the top-K beams. This process repeats until the final step, where the highest-scoring beam is selected as the output.
- Domain:
- Ml Pipeline
- Audience:
- Machine learning engineers optimizing inference with beam search and test-time scaling
Generated by Diagrams.so — AI architecture diagram generator with native Draw.io output. Fork this diagram, remix it, or download as .drawio, PNG, or SVG.