ADVU System Dataflow ER Diagram
About This Architecture
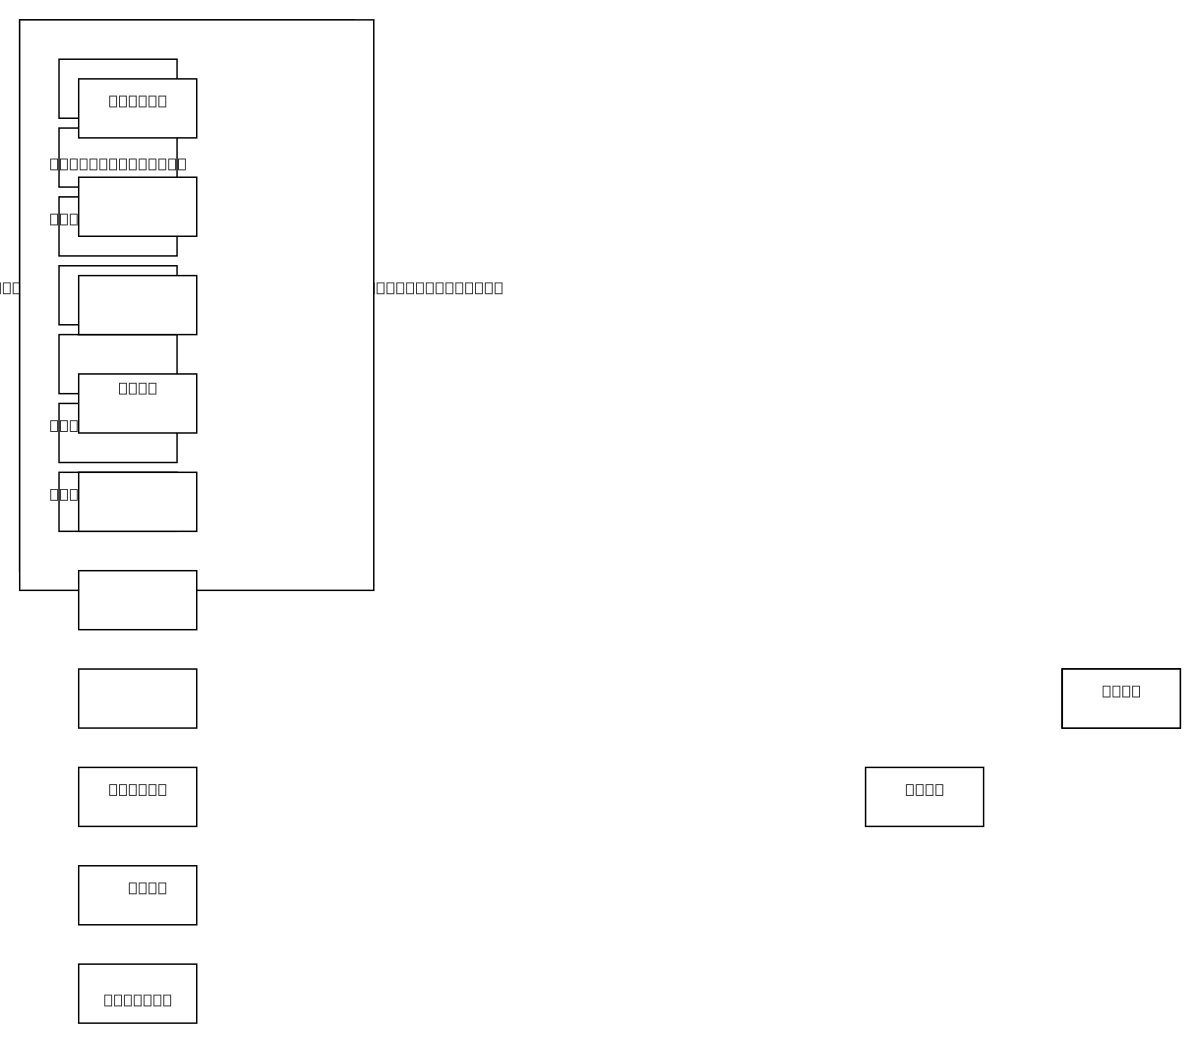
ADVU system dataflow ER diagram maps nine source systems—RCLOSC, E5UK, EURG, TOTL, FIMR, PFEX, BOOST, SUPSPM, and BIPD—feeding client, transaction, and sales data into a centralized hub via numbered integration flows. Each source entity maintains a primary key and connects to the ADVU system through identified or unidentified dataflows, with crow-foot notation indicating one-to-many relationships. This architecture demonstrates enterprise data consolidation across disparate business domains including client management, billing, e-commerce, and logistics. Fork and customize this diagram on Diagrams.so to document your own multi-source ETL topology, add transformation logic, or export as .drawio for integration into data governance documentation. The INCONNU (unknown) source placeholder highlights the importance of source discovery and lineage tracking in mature data platforms.
People also ask
How do I document and visualize dataflows from multiple source systems into a centralized data platform?
The ADVU system dataflow ER diagram shows how to map nine disparate sources—including RCLOSC, E5UK, EURG, TOTL, FIMR, PFEX, BOOST, SUPSPM, and BIPD—into a single hub using numbered integration flows and crow-foot cardinality notation. Solid lines represent identified dataflows while dashed lines indicate unidentified or optional flows, enabling data engineers to track lineage, identify gaps, and p
- Domain:
- Data Engineering
- Audience:
- Data engineers designing enterprise data integration and ETL pipelines
Generated by Diagrams.so — AI architecture diagram generator with native Draw.io output. Fork this diagram, remix it, or download as .drawio, PNG, or SVG.