WattWise ERD - Smart Energy Monitor
About This Architecture
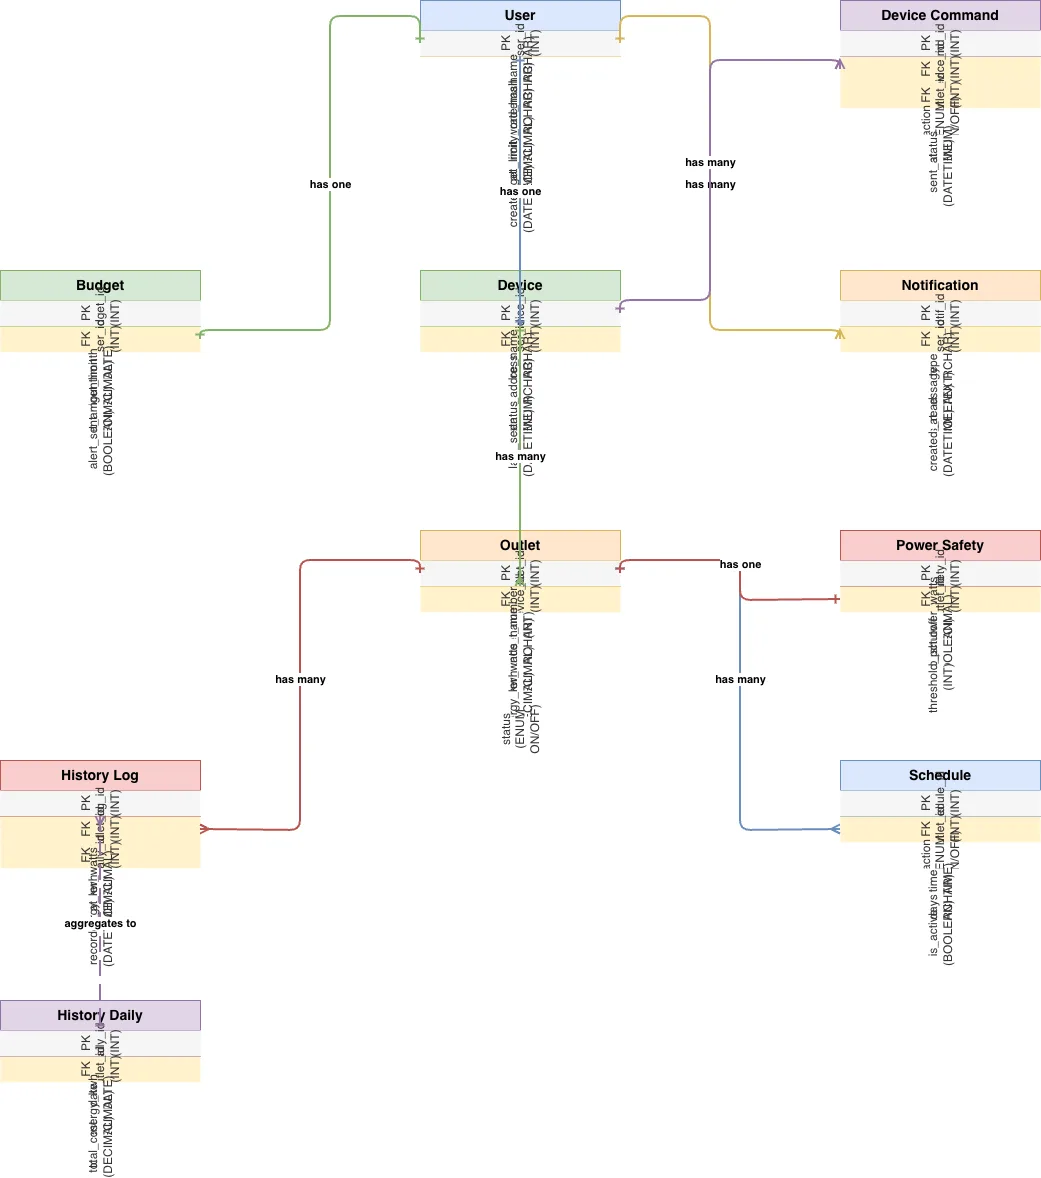
WattWise ERD models a comprehensive smart energy monitoring platform with nine interconnected entities tracking users, IoT devices, power outlets, and consumption patterns. Data flows from Device and Outlet entities through History Log and History Daily for granular and aggregated energy tracking, while Budget and Notification entities manage user alerts and spending limits. The schema demonstrates normalized database design for real-time power monitoring, historical analytics, and automated safety controls—essential for IoT applications requiring reliable audit trails and multi-tenant isolation. Fork this diagram on Diagrams.so to customize table relationships, add indexes, or adapt the schema for your AWS RDS or DynamoDB implementation. The Power Safety and Device Command entities exemplify how to layer automation and safety constraints into an energy management system.
People also ask
What does a normalized database schema look like for an IoT smart energy monitoring platform?
The WattWise ERD shows a nine-table normalized schema where User entities own Devices, Devices contain Outlets, and Outlets generate History Log entries aggregated into History Daily summaries. Budget, Notification, Schedule, Power Safety, and Device Command tables layer in cost tracking, alerts, automation, and safety constraints—a production-ready pattern for AWS RDS-backed IoT applications.
- Domain:
- Data Engineering
- Audience:
- Backend engineers and database architects designing IoT energy monitoring systems
Generated by Diagrams.so — AI architecture diagram generator with native Draw.io output. Fork this diagram, remix it, or download as .drawio, PNG, or SVG.