Tagetik Data Model Pipeline
About This Architecture
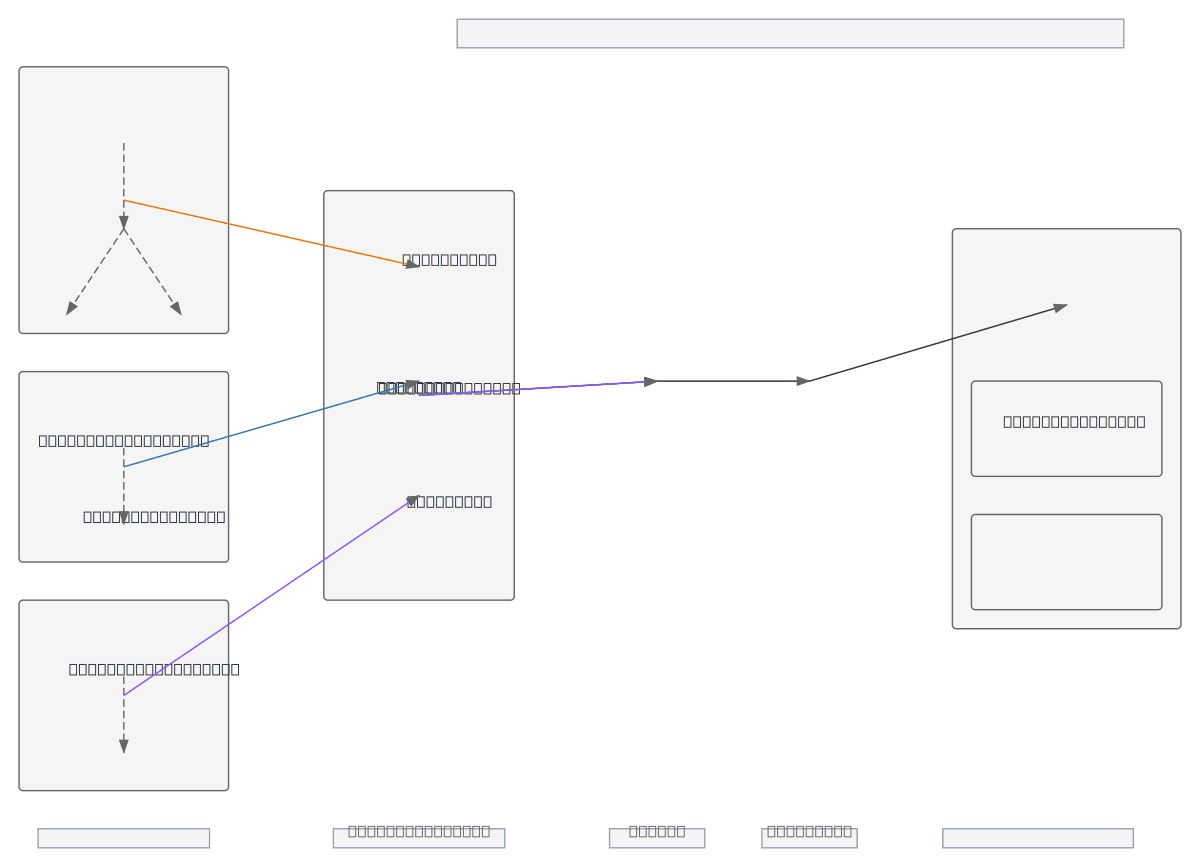
Tagetik Data Model Pipeline orchestrates a multi-stage financial data transformation from initialization through standardization to reporting outputs. The architecture splits processing into three parallel streams—Base, Left Hand Side (LHS), and Right Hand Side (RHS)—each initialized, calculated, and standardized independently before converging into unified Output and Reporting Datasets. This modular design enables financial workspace (FWS) teams to manage working capital and cashflow calculations with clear separation of concerns and reusable transformation logic. Fork this diagram on Diagrams.so to customize stage names, add data quality checkpoints, or integrate with your Tagetik environment. The three-stream pattern is ideal for complex financial models requiring parallel computation paths that merge at standardization.
People also ask
How does Tagetik organize data transformation from initialization through standardization to financial reporting?
The Tagetik Data Model Pipeline splits financial data into three parallel streams—Base, LHS, and RHS—each undergoing initialization, calculation, and standardization before merging into unified Output and Reporting Datasets that feed the Financial Workspace. This architecture enables modular processing of working capital and cashflow calculations with clear data lineage and reusable transformation
- Domain:
- Data Engineering
- Audience:
- Financial data engineers and Tagetik administrators building multi-stage data transformation pipelines
Generated by Diagrams.so — AI architecture diagram generator with native Draw.io output. Fork this diagram, remix it, or download as .drawio, PNG, or SVG.